在本文中,我们讨论 OpenCV 的 drawKeypoints() 函数。使图像脱颖而出的独特品质被称为图像中的关键点。特定图像的关键点让我们能够识别物体并比较图像。可以使用多种技术和算法来检测图片中的关键点。我们利用OpenCV中的drawKeypoints()方法能够在给定图片上绘制识别出的关键点。输入图片、关键点、颜色和标志被发送到drawKeypoints()方法。关键点是检测中最重要的方面。即使图像被修改后,关键点仍然保持不变。目前,我们只能使用SIRF_create()函数,因为surf函数已获得专利。
Syntax of drawKeypoints() function:
drawKeypoints(input_image, key_points, output_image, colour, flag)
parameters:
- input_image : The image which is turned into grayscale and then the key points are extracted using the SURF or SIFT algorithms is called input image.
- key_points : The key points obtained from the input picture after using the algorithms are referred to as keypoints.
- output_image : image on which the keypoints are drawn.
- colour : the colour of the keypoints.
- flag : drawing features are represented by the flag.
示例 1:
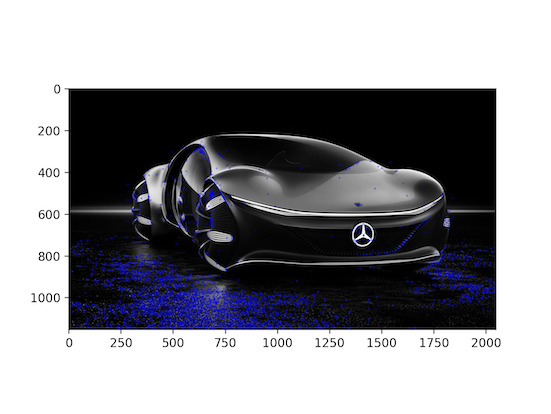
此示例首先导入 OpenCV 和 matplotlib 包。我们读取图像,将其转换为灰度,然后应用SIRF_create()算法来帮助我们检测图像中的关键点。 drawKeypoints()函数接收多个参数并在图像上绘制关键点。标志可以改变。在下面的示例中,我们使用 cv2.DRAW_MATCHES_FLAGS_NOT_DRAW_SINGLE_POINTS 作为标志。绘制输出图像。除了使用 cv2.SIRF_create() 之外,还可以使用 cv2.xfeatures2d.SIFT_create() ,在 OpenCV 的几个版本中它可能不起作用。 cv2.xfeatures2d.SURF_create() 算法也是如此。
注意:红色为 (255,0,0),蓝色为 (0,0,255),绿色为 (0,255,0)。
使用的图像:

Python3
# importing packages
import cv2
import matplotlib.pyplot as plt

# reading image using the imread() function
imageread = cv2.imread('img1.jpeg')

# input image is converted to gray scale image
imagegray = cv2.cvtColor(imageread, cv2.COLOR_BGR2GRAY)

# using the SIRF algorithm to detect key
# points in the image
features = cv2.SIFT_create()

keypoints = features.detect(imagegray, None)

# drawKeypoints function is used to draw keypoints
output_image = cv2.drawKeypoints(imagegray, keypoints, 0, (0, 0, 255),
                                 flags=cv2.DRAW_MATCHES_FLAGS_NOT_DRAW_SINGLE_POINTS)

# displaying the image with keypoints as the
# output on the screen

plt.imshow(output_image)

# plotting image
plt.show()
输出:
示例 2:
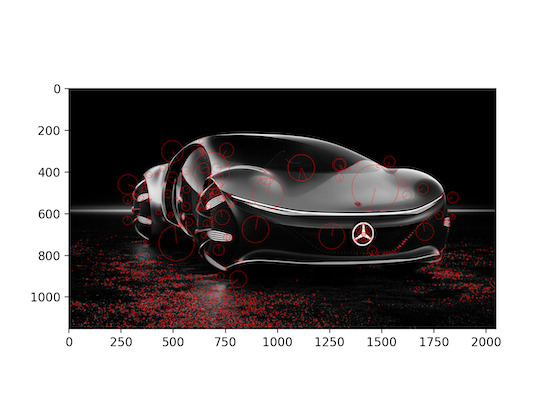
此示例与上一个示例类似,只是我们将颜色更改为红色 (255,0,0),并将标志更改为 cv2.DRAW_MATCHES_FLAGS_DRAW_RICH_KEYPOINTS。
Python3
# importing packages
import cv2
import matplotlib.pyplot as plt

# reading image using the imread() function
imageread = cv2.imread('img1.jpeg')

# input image is converted to gray scale image
imagegray = cv2.cvtColor(imageread, cv2.COLOR_BGR2GRAY)

# using the SIRF algorithm to detect key
# points in the image
features = cv2.SIFT_create()

keypoints = features.detect(imagegray, None)

# drawKeypoints function is used to draw keypoints
output_image = cv2.drawKeypoints(imagegray, keypoints, 0, (255, 0, 0),
                                 flags=cv2.DRAW_MATCHES_FLAGS_DRAW_RICH_KEYPOINTS)

# displaying the image with keypoints as the
# output on the screen
plt.imshow(output_image)

# plotting image
plt.show()
输出:
示例3:
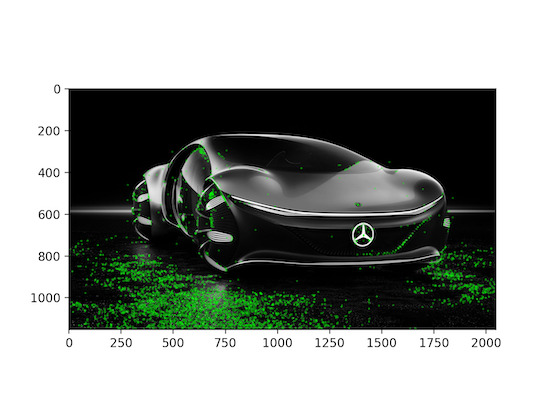
此示例与上一个示例类似,只是我们将颜色更改为绿色 (0,255,0),并将标志更改为 cv2.DRAW_MATCHES_FLAGS_DEFAULT。
Python3
import cv2
import matplotlib.pyplot as plt

# reading image using the imread() function
imageread = cv2.imread('img1.jpeg')

# input image is converted to gray scale image
imagegray = cv2.cvtColor(imageread, cv2.COLOR_BGR2GRAY)

# using the SIRF algorithm to detect key
# points in the image
features = cv2.SIFT_create()

keypoints = features.detect(imagegray, None)

# drawKeypoints function is used to draw keypoints
output_image = cv2.drawKeypoints(imagegray, keypoints, 0, (0, 255, 0),
                                 flags=cv2.DRAW_MATCHES_FLAGS_DEFAULT)

# displaying the image with keypoints as
# the output on the screen
plt.imshow(output_image)

# plotting image
plt.show()
输出:
相关用法
- Python OpenCV drawMatchesKnn()用法及代码示例
- Python OpenCV destroyAllWindows()用法及代码示例
- Python OpenCV distanceTransform()用法及代码示例
- Python OpenCV destroyWindow()用法及代码示例
- Python OpenCV cv2.circle()用法及代码示例
- Python OpenCV cv2.blur()用法及代码示例
- Python OpenCV cv2.ellipse()用法及代码示例
- Python OpenCV cv2.cvtColor()用法及代码示例
- Python OpenCV cv2.copyMakeBorder()用法及代码示例
- Python OpenCV cv2.imread()用法及代码示例
- Python OpenCV cv2.imshow()用法及代码示例
- Python OpenCV cv2.imwrite()用法及代码示例
- Python OpenCV cv2.putText()用法及代码示例
- Python OpenCV cv2.rectangle()用法及代码示例
- Python OpenCV cv2.arrowedLine()用法及代码示例
- Python OpenCV cv2.erode()用法及代码示例
- Python OpenCV cv2.line()用法及代码示例
- Python OpenCV cv2.flip()用法及代码示例
- Python OpenCV cv2.transpose()用法及代码示例
- Python OpenCV cv2.rotate()用法及代码示例
- Python OpenCV cv2.polylines()用法及代码示例
- Python OpenCV Canny()用法及代码示例
- Python OpenCV Filter2D()用法及代码示例
- Python OpenCV getgaussiankernel()用法及代码示例
- Python OpenCV getRotationMatrix2D()用法及代码示例
注:本文由纯净天空筛选整理自isitapol2002大神的英文原创作品 Python OpenCV – drawKeypoints() Function。非经特殊声明,原始代码版权归原作者所有,本译文未经允许或授权,请勿转载或复制。