D3.js中的d3.axis.scale()函数用于设置比例并返回轴。如果此函数未提供指定比例,则返回当前比例。
用法:
axis.scale([scale])
参数:该函数仅接受如上所述和以下描述的单个参数:
- scale:此参数是可选参数,它保存使用的比例。
返回值:该函数返回轴。
以下程序说明了D3.js中的d3.axis.scale()函数:
范例1:
HTML
<!DOCTYPE html>
<html>

<head>
    <title>
        D3.js | d3.axisBottom() Function
    </title>
    <script type="text/javascript"
        src="https://d3js.org/d3.v4.min.js">
    </script>

    <style>
        svg text {
            fill:green;
            font:15px sans-serif;
            text-anchor:center;
        }
    </style>
</head>

<body>
    <script>
        var width = 400, height = 400;
        var svg = d3.select("body")
            .append("svg")
            .attr("width", width)
            .attr("height", height);

        var xscale = d3.scaleLinear()
            .domain([0, 10])
            .range([0, width - 60]);

        var x_axis = d3.axisBottom().scale(xscale);

        var xAxisTranslate = height / 2;

        svg.append("g")
            .attr("transform", "translate(50, "
            + xAxisTranslate + ")")
            .call(x_axis)
    </script>
</body>
</html>
输出:

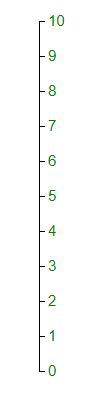
范例2:
HTML
<!DOCTYPE html>
<html>

<head>
    <title>
        D3.js | d3.axisRight() Function
    </title>
    <script type="text/javascript"
        src="https://d3js.org/d3.v4.min.js">
    </script>

    <style>
        svg text {
            fill:green;
            font:15px sans-serif;
            text-anchor:start;
        }
    </style>
</head>

<body>
    <script>
        var width = 400, height = 400;
        var svg = d3.select("body")
            .append("svg")
            .attr("width", width)
            .attr("height", height);

        var yscale = d3.scaleLinear()
            .domain([0, 10])
            .range([height - 50, 0]);

        var y_axis = d3.axisRight().scale(yscale);


        svg.append("g")
            .attr("transform", "translate(100,20)")
            .call(y_axis)
    </script>
</body>
</html>
输出:
相关用法
- d3.js d3.set.add()用法及代码示例
- p5.js nfs()用法及代码示例
- PHP Ds\Set last()用法及代码示例
- p5.js nfp()用法及代码示例
- PHP Ds\Set add()用法及代码示例
- PHP min( )用法及代码示例
- p5.js nf()用法及代码示例
- p5.js nfc()用法及代码示例
- p5.js arc()用法及代码示例
- d3.js d3.mean()用法及代码示例
- PHP Ds\Map get()用法及代码示例
- p5.js box()用法及代码示例
- PHP pos()用法及代码示例
- PHP each()用法及代码示例
- d3.js d3.map.set()用法及代码示例
- d3.js now()用法及代码示例
注:本文由纯净天空筛选整理自SHUBHAMSINGH10大神的英文原创作品 D3.js axis.scale() Function。非经特殊声明,原始代码版权归原作者所有,本译文未经允许或授权,请勿转载或复制。