本文簡要介紹 python 語言中 scipy.signal.hilbert 的用法。
用法:
scipy.signal.hilbert(x, N=None, axis=-1)#使用希爾伯特變換計算解析信號。
默認情況下,轉換沿最後一個軸完成。
- x: array_like
信號數據。一定是真的。
- N: 整數,可選
傅裏葉分量的數量。默認值:
x.shape[axis]- axis: 整數,可選
沿其進行轉換的軸。默認值:-1。
- xa: ndarray
沿軸的每個一維陣列的 x 的解析信號
參數 ::
返回 ::
注意:
信號
x(t)的解析信號x_a(t)為:其中F是傅裏葉變換,U單位階躍函數,和y希爾伯特變換x.[1]
換句話說,頻譜的負半部分被歸零,將實值信號變為複信號。希爾伯特變換信號可以從
np.imag(hilbert(x))獲得,原始信號可以從np.real(hilbert(x))獲得。參考:
[1]維基百科,“Analytic signal”。 https://en.wikipedia.org/wiki/Analytic_signal
[2]Leon Cohen,“Time-Frequency 分析”,1995 年。第 2 章。
[3]艾倫·V·奧本海姆、羅納德·W·謝弗。 Discrete-Time 信號處理,第三版,2009 年。第 12 章。ISBN 13:978-1292-02572-8
例子:
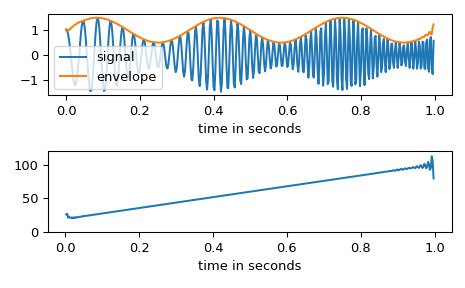
在本例中,我們使用希爾伯特變換來確定amplitude-modulated 信號的幅度包絡和瞬時頻率。
>>> import numpy as np
>>> import matplotlib.pyplot as plt
>>> from scipy.signal import hilbert, chirp
>>> duration = 1.0 >>> fs = 400.0 >>> samples = int(fs*duration) >>> t = np.arange(samples) / fs我們創建一個頻率從 20 Hz 增加到 100 Hz 的啁啾,並應用幅度調製。
>>> signal = chirp(t, 20.0, t[-1], 100.0)
>>> signal *= (1.0 + 0.5 * np.sin(2.0*np.pi*3.0*t) )
幅度包絡由分析信號的幅度給出。瞬時頻率可以通過瞬時相位對時間的微分獲得。瞬時相位對應於解析信號的相位角。
>>> analytic_signal = hilbert(signal)
>>> amplitude_envelope = np.abs(analytic_signal)
>>> instantaneous_phase = np.unwrap(np.angle(analytic_signal))
>>> instantaneous_frequency = (np.diff(instantaneous_phase) /
...                            (2.0*np.pi) * fs)
>>> fig, (ax0, ax1) = plt.subplots(nrows=2) >>> ax0.plot(t, signal, label='signal') >>> ax0.plot(t, amplitude_envelope, label='envelope') >>> ax0.set_xlabel("time in seconds") >>> ax0.legend() >>> ax1.plot(t[1:], instantaneous_frequency) >>> ax1.set_xlabel("time in seconds") >>> ax1.set_ylim(0.0, 120.0) >>> fig.tight_layout()
相關用法
- Python SciPy signal.czt_points用法及代碼示例
- Python SciPy signal.chirp用法及代碼示例
- Python SciPy signal.residue用法及代碼示例
- Python SciPy signal.iirdesign用法及代碼示例
- Python SciPy signal.max_len_seq用法及代碼示例
- Python SciPy signal.kaiser_atten用法及代碼示例
- Python SciPy signal.oaconvolve用法及代碼示例
- Python SciPy signal.ricker用法及代碼示例
- Python SciPy signal.group_delay用法及代碼示例
- Python SciPy signal.cheb2ord用法及代碼示例
- Python SciPy signal.get_window用法及代碼示例
- Python SciPy signal.lfilter用法及代碼示例
- Python SciPy signal.morlet用法及代碼示例
- Python SciPy signal.coherence用法及代碼示例
- Python SciPy signal.dfreqresp用法及代碼示例
- Python SciPy signal.TransferFunction用法及代碼示例
- Python SciPy signal.dbode用法及代碼示例
- Python SciPy signal.residuez用法及代碼示例
- Python SciPy signal.bilinear_zpk用法及代碼示例
- Python SciPy signal.firls用法及代碼示例
- Python SciPy signal.impulse用法及代碼示例
- Python SciPy signal.buttord用法及代碼示例
- Python SciPy signal.find_peaks用法及代碼示例
- Python SciPy signal.freqs用法及代碼示例
- Python SciPy signal.step2用法及代碼示例
注:本文由純淨天空篩選整理自scipy.org大神的英文原創作品 scipy.signal.hilbert。非經特殊聲明,原始代碼版權歸原作者所有,本譯文未經允許或授權,請勿轉載或複製。
