本文簡要介紹 python 語言中 scipy.misc.electrocardiogram 的用法。
用法:
scipy.misc.electrocardiogram()#加載心電圖作為一維信號的示例。
返回的信號是 5 分鍾長的心電圖 (ECG),它是心髒電活動的醫學記錄,以 360 Hz 采樣。
- ecg: ndarray
以 360 Hz 采樣的以毫伏 (mV) 為單位的心電圖。
返回 ::
注意:
提供的信號是 PhysioNet [2] 上 MIT-BIH 心律失常數據庫 [1] 提供的 record 208(導聯 MLII)的摘錄(19:35 至 24:35)。摘錄包括噪聲引起的偽影、典型的心跳以及病理變化。
參考:
[1]穆迪 GB,馬克 RG。 MIT-BIH 心律失常數據庫的影響。 IEEE Eng in Med and Biol 20(3):45-50 (May-June 2001)。 (PMID:11446209); DOI:10.13026/C2F305
[2]Goldberger AL, Amaral LAN, Glass L, Hausdorff JM, Ivanov PCh, Mark RG, Mietus JE, Moody GB, Peng C-K, Stanley HE。 PhysioBank、PhysioToolkit 和 PhysioNet:複雜生理信號新研究資源的組成部分。循環 101(23):e215-e220; DOI:10.1161/01.CIR.101.23.e215
例子:
>>> from scipy.misc import electrocardiogram
>>> ecg = electrocardiogram()
>>> ecg
array([-0.245, -0.215, -0.185, ..., -0.405, -0.395, -0.385])
>>> ecg.shape, ecg.mean(), ecg.std()
((108000,), -0.16510875, 0.5992473991177294)
如前所述,信號具有不同形態的幾個區域。例如,前幾秒顯示正常竇性心律下心髒的電活動,如下所示。
>>> import numpy as np
>>> import matplotlib.pyplot as plt
>>> fs = 360
>>> time = np.arange(ecg.size) / fs
>>> plt.plot(time, ecg)
>>> plt.xlabel("time in s")
>>> plt.ylabel("ECG in mV")
>>> plt.xlim(9, 10.2)
>>> plt.ylim(-1, 1.5)
>>> plt.show()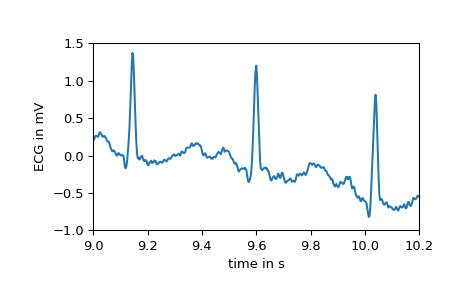
然而,在第二個 16 歲之後,出現了第一次室性早搏,也稱為期外收縮。與典型的心跳相比,它們具有不同的形態。在下圖中可以很容易地觀察到差異。
>>> plt.plot(time, ecg)
>>> plt.xlabel("time in s")
>>> plt.ylabel("ECG in mV")
>>> plt.xlim(46.5, 50)
>>> plt.ylim(-2, 1.5)
>>> plt.show()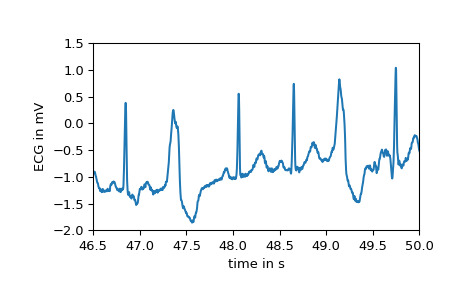
在幾個點上,大型偽影會幹擾記錄,例如:
>>> plt.plot(time, ecg)
>>> plt.xlabel("time in s")
>>> plt.ylabel("ECG in mV")
>>> plt.xlim(207, 215)
>>> plt.ylim(-2, 3.5)
>>> plt.show()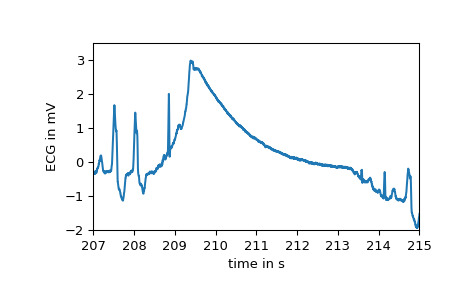
最後,檢查功率譜顯示大部分生物信號由較低頻率組成。在 60 Hz 時,可以清楚地觀察到由市電引起的噪聲。
>>> from scipy.signal import welch
>>> f, Pxx = welch(ecg, fs=fs, nperseg=2048, scaling="spectrum")
>>> plt.semilogy(f, Pxx)
>>> plt.xlabel("Frequency in Hz")
>>> plt.ylabel("Power spectrum of the ECG in mV**2")
>>> plt.xlim(f[[0, -1]])
>>> plt.show()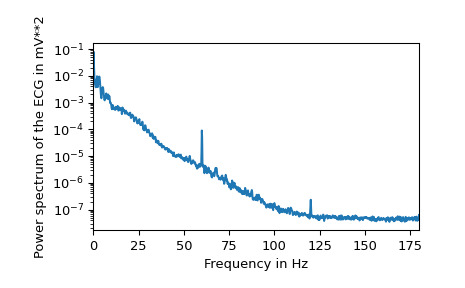
相關用法
- Python SciPy misc.ascent用法及代碼示例
- Python SciPy misc.derivative用法及代碼示例
- Python SciPy misc.face用法及代碼示例
- Python SciPy misc.central_diff_weights用法及代碼示例
- Python SciPy mstats.trim用法及代碼示例
- Python SciPy matlab.loadmat用法及代碼示例
- Python SciPy mstats.winsorize用法及代碼示例
- Python SciPy mstats.argstoarray用法及代碼示例
- Python SciPy matlab.savemat用法及代碼示例
- Python SciPy mstats.trima用法及代碼示例
- Python SciPy mstats.tmin用法及代碼示例
- Python SciPy mstats.tmax用法及代碼示例
- Python SciPy mstats.kruskalwallis用法及代碼示例
- Python SciPy mstats.sem用法及代碼示例
- Python SciPy mstats.zscore用法及代碼示例
- Python SciPy mstats.zmap用法及代碼示例
- Python SciPy mstats.mode用法及代碼示例
- Python SciPy mstats.hmean用法及代碼示例
- Python SciPy mstats.variation用法及代碼示例
- Python SciPy mstats.compare_medians_ms用法及代碼示例
- Python SciPy mstats.gmean用法及代碼示例
- Python SciPy mstats.pearsonr用法及代碼示例
- Python SciPy mstats.kruskal用法及代碼示例
- Python SciPy mstats.tmean用法及代碼示例
- Python SciPy mstats.mquantiles用法及代碼示例
注:本文由純淨天空篩選整理自scipy.org大神的英文原創作品 scipy.misc.electrocardiogram。非經特殊聲明,原始代碼版權歸原作者所有,本譯文未經允許或授權,請勿轉載或複製。