Pandas 係列是帶有軸標簽的一維ndarray。標簽不必是唯一的,但必須是可哈希的類型。該對象同時支持基於整數和基於標簽的索引,並提供了許多方法來執行涉及索引的操作。
Pandas Series.describe()函數會生成描述性統計信息,以匯總給定係列對象的數據集分布的集中趨勢,離散度和形狀。通過排除NaN值來執行所有計算。
用法: Series.describe(percentiles=None, include=None, exclude=None)
參數:
percentiles:要包含在輸出中的百分比。
include:要包含在結果中的數據類型的白名單。忽略係列。
exclude:要從結果中忽略的數據類型黑名單。忽略係列
返回:係列摘要統計
範例1:采用Series.describe()函數查找給定係列對象的摘要統計信息。
# importing pandas as pd
import pandas as pd

# Creating the Series
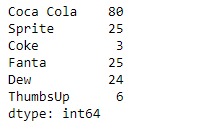
sr = pd.Series([80, 25, 3, 25, 24, 6])

# Create the Index
index_ = ['Coca Cola', 'Sprite', 'Coke', 'Fanta', 'Dew', 'ThumbsUp']

# set the index
sr.index = index_

# Print the series
print(sr)
輸出:

現在我們將使用Series.describe()函數以查找給定係列對象中基礎數據的摘要統計信息。
# find summary statistics of the underlying
# data in the given series object.
result = sr.describe()

# Print the result
print(result)
輸出:

正如我們在輸出中看到的,Series.describe()函數已成功返回給定係列對象的摘要統計信息。
範例2:采用Series.describe()函數以查找給定係列對象中基礎數據的摘要統計信息。給定的係列對象包含一些缺失值。
# importing pandas as pd
import pandas as pd

# Creating the Series
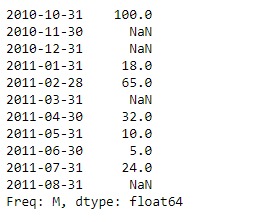
sr = pd.Series([100, None, None, 18, 65, None, 32, 10, 5, 24, None])

# Create the Index
index_ = pd.date_range('2010-10-09', periods = 11, freq ='M')

# set the index
sr.index = index_

# Print the series
print(sr)
輸出:

現在我們將使用Series.describe()函數以查找給定係列對象中基礎數據的摘要統計信息。
# find summary statistics of the underlying
# data in the given series object.
result = sr.describe()

# Print the result
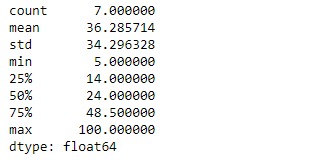
print(result)
輸出:

正如我們在輸出中看到的,Series.describe()函數已成功返回給定係列對象的摘要統計信息。NaN計算這些統計值時,將忽略這些值。
相關用法
- Python pandas.map()用法及代碼示例
- Python Pandas Series.str.len()用法及代碼示例
- Python Pandas.factorize()用法及代碼示例
- Python Pandas TimedeltaIndex.name用法及代碼示例
- Python Pandas dataframe.ne()用法及代碼示例
- Python Pandas Series.between()用法及代碼示例
- Python Pandas DataFrame.where()用法及代碼示例
- Python Pandas Series.add()用法及代碼示例
- Python Pandas.pivot_table()用法及代碼示例
- Python Pandas Series.mod()用法及代碼示例
- Python Pandas Dataframe.at[ ]用法及代碼示例
- Python Pandas Dataframe.iat[ ]用法及代碼示例
- Python Pandas.pivot()用法及代碼示例
- Python Pandas dataframe.mul()用法及代碼示例
- Python Pandas.melt()用法及代碼示例
注:本文由純淨天空篩選整理自Shubham__Ranjan大神的英文原創作品 Python | Pandas Series.describe()。非經特殊聲明,原始代碼版權歸原作者所有,本譯文未經允許或授權,請勿轉載或複製。
