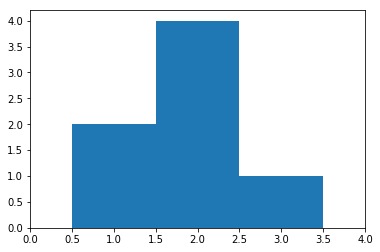
scipy.stats.histogram(a, numbins, defaultreallimits, weights, printextras) 可以将范围分为几个bin,然后返回每个bin中的实例数。此函数用于构建直方图。
参数:
arr:[数组]输入数组。
numbins :[int]用于直方图的bin数量。 [默认= 10]
defaultlimits:直方图的(较低,较高)范围。
weights :每个数组元素的[数组]权重。
printextras :[数组]打印否,如果额外指向标准输出,则为true
Results:
-累积频率合并值
-每个箱子的宽度
-下限
-加分。
代码1:
# building the histogram
import scipy
import numpy as np
import matplotlib.pyplot as plt

hist, bin_edges = scipy.histogram([1, 1, 2, 2, 2, 2, 3],
                                       bins = range(5))

# Checking the results
print ("No. of points in each bin:", hist)
print ("Size of the bins         :", bin_edges)

# plotting the histogram
plt.bar(bin_edges[:-1], hist, width = 1)
plt.xlim(min(bin_edges), max(bin_edges))
plt.show()
输出:
No. of points in each bin: [0 2 4 1]
Size of the bins         : [0 1 2 3 4]

相关用法
- Python Scipy stats.sem()用法及代码示例
- Python Scipy stats.mean()用法及代码示例
- Python Scipy stats.threshold()用法及代码示例
- Python Scipy stats.normaltest()用法及代码示例
- Python Scipy stats.kurtosistest()用法及代码示例
- Python Scipy stats.variation()用法及代码示例
- Python Scipy stats.trimboth()用法及代码示例
- Python Scipy stats.skewtest()用法及代码示例
- Python Scipy stats.nanstd()用法及代码示例
- Python Scipy stats.nanmean()用法及代码示例
- Python Scipy stats.nanmedian()用法及代码示例
- Python Scipy stats.binned_statistic_dd()用法及代码示例
- Python Scipy stats.moment()用法及代码示例
- Python Scipy stats.tmin()用法及代码示例
注:本文由纯净天空筛选整理自vishal3096大神的英文原创作品 sciPy stats.histogram() function | Python。非经特殊声明,原始代码版权归原作者所有,本译文未经允许或授权,请勿转载或复制。
