Tidy 总结了有关模型组件的信息。模型组件可能是回归中的单个项、单个假设、聚类或类。 tidy 所认为的模型组件的确切含义因模型而异,但通常是不言而喻的。如果模型具有多种不同类型的组件,您将需要指定要返回哪些组件。
参数
- x
-
lsmobj对象。 - conf.int
-
逻辑指示是否在整理的输出中包含置信区间。默认为
FALSE。 - conf.level
-
用于置信区间的置信水平(如果
conf.int = TRUE)。必须严格大于 0 且小于 1。默认为 0.95,对应于 95% 的置信区间。 - ...
-
传递给
emmeans::summary.emmGrid()或lsmeans::summary.ref.grid()的其他参数。注意:错误指定的参数可能会被默默忽略!
细节
返回一个 DataFrame ,其中包含每个估计边际均值的一个观测值,以及每个因子组合的一列。当输入是对比度时,每一行将包含一个估计的对比度。
有大量参数可以传递给 emmeans::summary.emmGrid() 或 lsmeans::summary.ref.grid() 。
也可以看看
tidy() , emmeans::ref_grid() , emmeans::emmeans() , emmeans::contrast()
其他 emmeans 整理器: tidy.emmGrid() 、 tidy.ref.grid() 、 tidy.summary_emm()
值
带有列的 tibble::tibble():
- conf.high
-
估计置信区间的上限。
- conf.low
-
估计置信区间的下限。
- contrast
-
正在比较的级别。
- df
-
该术语在模型中使用的自由度。
- null.value
-
与估计值进行比较的值。
- p.value
-
与观察到的统计量相关的两侧 p 值。
- std.error
-
回归项的标准误差。
- estimate
-
预期边际平均值
- statistic
-
T-ratio统计
例子
# load libraries for models and data
library(emmeans)

# linear model for sales of oranges per day
oranges_lm1 <- lm(sales1 ~ price1 + price2 + day + store, data = oranges)

# reference grid; see vignette("basics", package = "emmeans")
oranges_rg1 <- ref_grid(oranges_lm1)
td <- tidy(oranges_rg1)
td
#> # A tibble: 36 × 9
#>    price1 price2 day   store estimate std.error    df statistic   p.value
#>     <dbl>  <dbl> <chr> <chr>    <dbl>     <dbl> <dbl>     <dbl>     <dbl>
#>  1   51.2   48.6 1     1         2.92      2.72    23      1.07 0.294
#>  2   51.2   48.6 2     1         3.85      2.70    23      1.42 0.168
#>  3   51.2   48.6 3     1        11.0       2.53    23      4.35 0.000237
#>  4   51.2   48.6 4     1         6.10      2.65    23      2.30 0.0309
#>  5   51.2   48.6 5     1        12.8       2.44    23      5.23 0.0000261
#>  6   51.2   48.6 6     1         8.75      2.79    23      3.14 0.00459
#>  7   51.2   48.6 1     2         4.96      2.38    23      2.09 0.0482
#>  8   51.2   48.6 2     2         5.89      2.34    23      2.52 0.0190
#>  9   51.2   48.6 3     2        13.1       2.42    23      5.41 0.0000172
#> 10   51.2   48.6 4     2         8.14      2.35    23      3.46 0.00212
#> # ℹ 26 more rows

# marginal averages
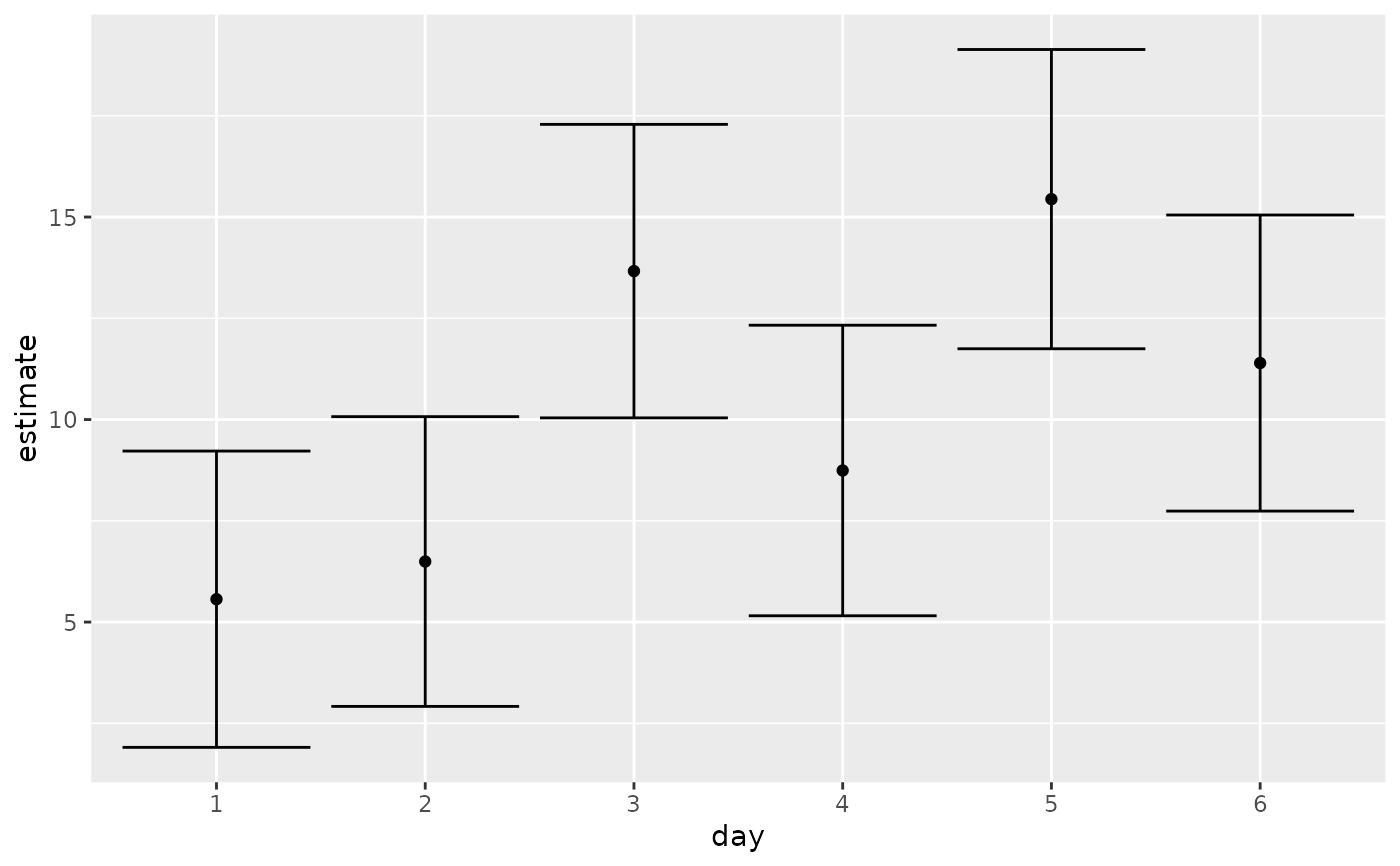
marginal <- emmeans(oranges_rg1, "day")
tidy(marginal)
#> # A tibble: 6 × 6
#>   day   estimate std.error    df statistic      p.value
#>   <chr>    <dbl>     <dbl> <dbl>     <dbl>        <dbl>
#> 1 1         5.56      1.77    23      3.15 0.00451
#> 2 2         6.49      1.73    23      3.76 0.00103
#> 3 3        13.7       1.75    23      7.80 0.0000000658
#> 4 4         8.74      1.73    23      5.04 0.0000420
#> 5 5        15.4       1.79    23      8.65 0.0000000110
#> 6 6        11.4       1.77    23      6.45 0.00000140

# contrasts
tidy(contrast(marginal))
#> # A tibble: 6 × 8
#>   term  contrast null.value estimate std.error    df statistic adj.p.value
#>   <chr> <chr>         <dbl>    <dbl>     <dbl> <dbl>     <dbl>       <dbl>
#> 1 day   day1 ef…          0    -4.65      1.62    23    -2.87       0.0261
#> 2 day   day2 ef…          0    -3.72      1.58    23    -2.36       0.0547
#> 3 day   day3 ef…          0     3.45      1.60    23     2.15       0.0637
#> 4 day   day4 ef…          0    -1.47      1.59    23    -0.930      0.434
#> 5 day   day5 ef…          0     5.22      1.64    23     3.18       0.0249
#> 6 day   day6 ef…          0     1.18      1.62    23     0.726      0.475
tidy(contrast(marginal, method = "pairwise"))
#> # A tibble: 15 × 8
#>    term  contrast    null.value estimate std.error    df statistic
#>    <chr> <chr>            <dbl>    <dbl>     <dbl> <dbl>     <dbl>
#>  1 day   day1 - day2          0   -0.930      2.47    23    -0.377
#>  2 day   day1 - day3          0   -8.10       2.47    23    -3.29
#>  3 day   day1 - day4          0   -3.18       2.51    23    -1.27
#>  4 day   day1 - day5          0   -9.88       2.56    23    -3.86
#>  5 day   day1 - day6          0   -5.83       2.52    23    -2.31
#>  6 day   day2 - day3          0   -7.17       2.48    23    -2.89
#>  7 day   day2 - day4          0   -2.25       2.44    23    -0.920
#>  8 day   day2 - day5          0   -8.95       2.52    23    -3.56
#>  9 day   day2 - day6          0   -4.90       2.45    23    -2.00
#> 10 day   day3 - day4          0    4.92       2.49    23     1.98
#> 11 day   day3 - day5          0   -1.78       2.47    23    -0.719
#> 12 day   day3 - day6          0    2.27       2.54    23     0.894
#> 13 day   day4 - day5          0   -6.70       2.49    23    -2.69
#> 14 day   day4 - day6          0   -2.65       2.45    23    -1.08
#> 15 day   day5 - day6          0    4.05       2.56    23     1.58
#> # ℹ 1 more variable: adj.p.value <dbl>

# plot confidence intervals
library(ggplot2)

ggplot(tidy(marginal, conf.int = TRUE), aes(day, estimate)) +
  geom_point() +
  geom_errorbar(aes(ymin = conf.low, ymax = conf.high))


# by multiple prices
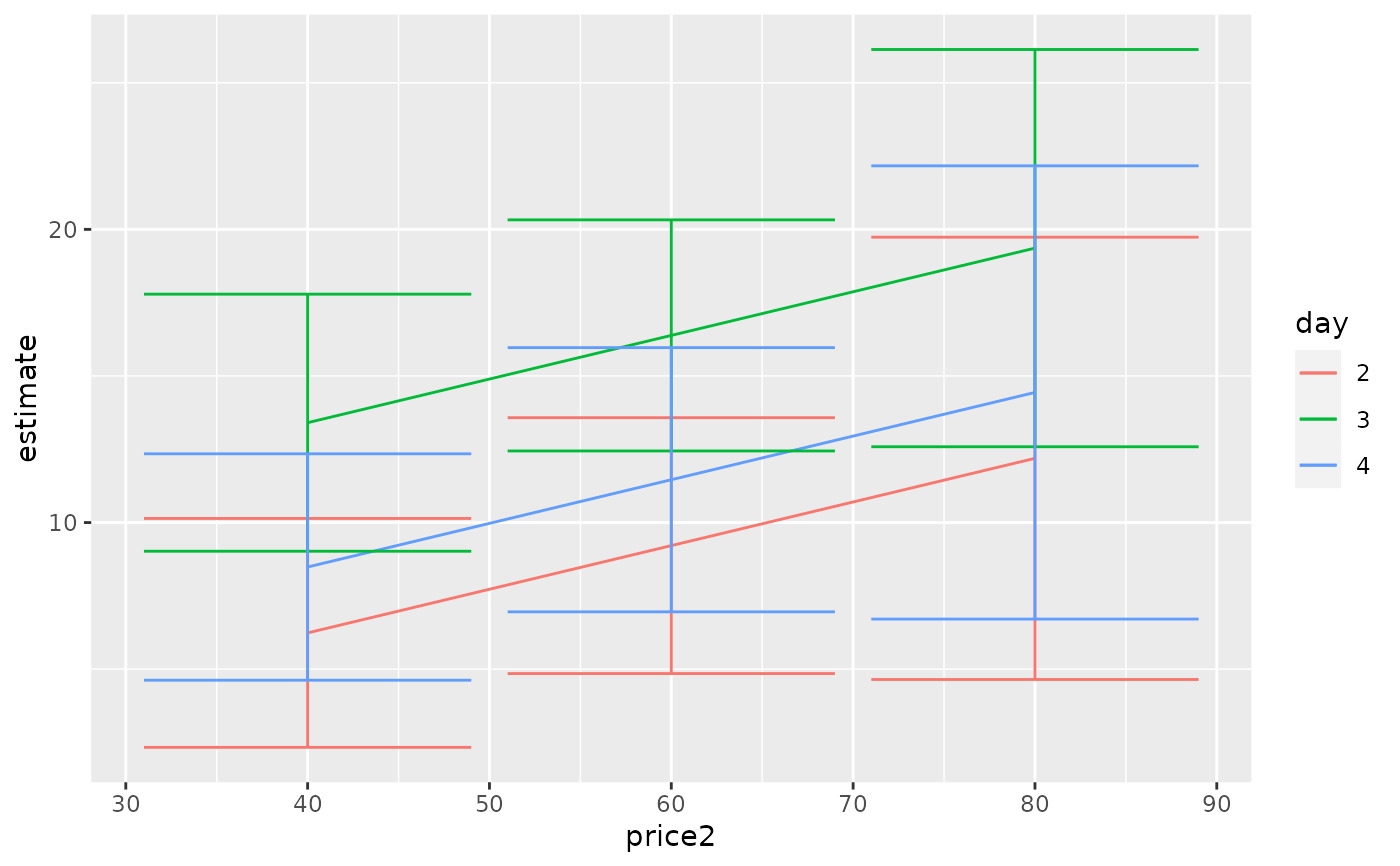
by_price <- emmeans(oranges_lm1, "day",
  by = "price2",
  at = list(
    price1 = 50, price2 = c(40, 60, 80),
    day = c("2", "3", "4")
  )
)

by_price
#> price2 = 40:
#>  day emmean   SE df lower.CL upper.CL
#>  2     6.24 1.89 23     2.33     10.1
#>  3    13.41 2.12 23     9.02     17.8
#>  4     8.48 1.87 23     4.62     12.3
#>
#> price2 = 60:
#>  day emmean   SE df lower.CL upper.CL
#>  2     9.21 2.11 23     4.85     13.6
#>  3    16.38 1.91 23    12.44     20.3
#>  4    11.46 2.18 23     6.96     16.0
#>
#> price2 = 80:
#>  day emmean   SE df lower.CL upper.CL
#>  2    12.19 3.65 23     4.65     19.7
#>  3    19.36 3.27 23    12.59     26.1
#>  4    14.44 3.74 23     6.71     22.2
#>
#> Results are averaged over the levels of: store
#> Confidence level used: 0.95

tidy(by_price)
#> # A tibble: 9 × 7
#>   day   price2 estimate std.error    df statistic      p.value
#>   <chr>  <dbl>    <dbl>     <dbl> <dbl>     <dbl>        <dbl>
#> 1 2         40     6.24      1.89    23      3.30 0.00310
#> 2 3         40    13.4       2.12    23      6.33 0.00000187
#> 3 4         40     8.48      1.87    23      4.55 0.000145
#> 4 2         60     9.21      2.11    23      4.37 0.000225
#> 5 3         60    16.4       1.91    23      8.60 0.0000000122
#> 6 4         60    11.5       2.18    23      5.26 0.0000244
#> 7 2         80    12.2       3.65    23      3.34 0.00282
#> 8 3         80    19.4       3.27    23      5.91 0.00000502
#> 9 4         80    14.4       3.74    23      3.86 0.000788

ggplot(tidy(by_price, conf.int = TRUE), aes(price2, estimate, color = day)) +
  geom_line() +
  geom_errorbar(aes(ymin = conf.low, ymax = conf.high))


# joint_tests
tidy(joint_tests(oranges_lm1))
#> # A tibble: 4 × 5
#>   term   num.df den.df statistic   p.value
#>   <chr>   <dbl>  <dbl>     <dbl>     <dbl>
#> 1 price1      1     23     30.3  0.0000134
#> 2 price2      1     23      2.23 0.149
#> 3 day         5     23      4.88 0.00346
#> 4 store       5     23      2.52 0.0583
相关用法
- R broom tidy.lmRob 整理 a(n) lmRob 对象
- R broom tidy.lm 整理 a(n) lm 对象
- R broom tidy.lavaan 整理一个熔岩物体
- R broom tidy.lmodel2 整理 a(n) lmodel2 对象
- R broom tidy.lm.beta 整理 a(n) lm.beta 对象
- R broom tidy.robustbase.glmrob 整理 a(n) glmrob 对象
- R broom tidy.acf 整理 a(n) acf 对象
- R broom tidy.robustbase.lmrob 整理 a(n) lmrob 对象
- R broom tidy.biglm 整理 a(n) biglm 对象
- R broom tidy.garch 整理 a(n) garch 对象
- R broom tidy.rq 整理 a(n) rq 对象
- R broom tidy.kmeans 整理 a(n) kmeans 对象
- R broom tidy.betamfx 整理 a(n) betamfx 对象
- R broom tidy.anova 整理 a(n) anova 对象
- R broom tidy.btergm 整理 a(n) btergm 对象
- R broom tidy.cv.glmnet 整理 a(n) cv.glmnet 对象
- R broom tidy.roc 整理 a(n) roc 对象
- R broom tidy.poLCA 整理 a(n) poLCA 对象
- R broom tidy.emmGrid 整理 a(n) emmGrid 对象
- R broom tidy.Kendall 整理 a(n) Kendall 对象
- R broom tidy.survreg 整理 a(n) survreg 对象
- R broom tidy.ergm 整理 a(n) ergm 对象
- R broom tidy.pairwise.htest 整理 a(n)pairwise.htest 对象
- R broom tidy.coeftest 整理 a(n) coeftest 对象
- R broom tidy.polr 整理 a(n) polr 对象
注:本文由纯净天空筛选整理自等大神的英文原创作品 Tidy a(n) lsmobj object。非经特殊声明,原始代码版权归原作者所有,本译文未经允许或授权,请勿转载或复制。
