本文简要介绍python语言中 sklearn.metrics.plot_det_curve 的用法。
用法:
sklearn.metrics.plot_det_curve(estimator, X, y, *, sample_weight=None, response_method='auto', name=None, ax=None, pos_label=None, **kwargs)已弃用:函数 plot_det_curve 在 1.0 中已弃用,并将在 1.2 中删除。使用以下类方法之一:DetCurveDisplay.from_predictions 或 DetCurveDisplay.from_estimator。
绘制检测误差权衡 (DET) 曲线。
额外的关键字参数将传递给 matplotlib 的
plot。在用户指南中阅读更多信息。
- estimator:估计器实例
拟合分类器或拟合
Pipeline,其中最后一个估计器是分类器。- X:{类数组,稀疏矩阵},形状为 (n_samples, n_features)
输入值。
- y:形状类似数组 (n_samples,)
目标值。
- sample_weight:形状类似数组 (n_samples,),默认=None
样本权重。
- response_method:{‘predict_proba’, ‘decision_function’, ‘auto’} 默认='自动'
指定是使用predict_proba 还是decision_function 作为预测的目标响应。如果设置为‘auto’,则首先尝试predict_proba,如果不存在,则接下来尝试decision_function。
- name:str,默认=无
用于标注的 DET 曲线名称。如果
None,使用估计器的名称。- ax:matplotlib 轴,默认=无
要绘制的轴对象。如果
None,则创建一个新的图形和轴。- pos_label:str 或 int,默认 = 无
正类的标签。当
pos_label=None时,如果y_true在 {-1, 1} 或 {0, 1} 中,则pos_label设置为 1,否则将引发错误。- **kwargs:dict
传递给 matplotlib
plot函数的其他关键字参数。
- display:sklearn.metrics.DetCurveDisplay
存储计算值的对象。
参数:
返回:
例子:
>>> import matplotlib.pyplot as plt
>>> from sklearn.datasets import make_classification
>>> from sklearn.metrics import plot_det_curve
>>> from sklearn.model_selection import train_test_split
>>> from sklearn.svm import SVC
>>> X, y = make_classification(n_samples=1000, random_state=0)
>>> X_train, X_test, y_train, y_test = train_test_split(
...     X, y, test_size=0.4, random_state=0)
>>> clf = SVC(random_state=0).fit(X_train, y_train)
>>> plot_det_curve(clf, X_test, y_test)
<...>
>>> plt.show()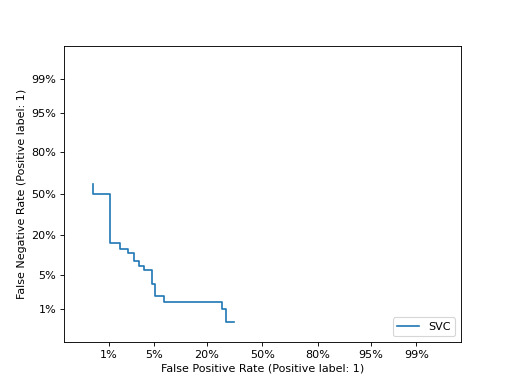
相关用法
- Python sklearn plot_confusion_matrix用法及代码示例
- Python sklearn.metrics.plot_roc_curve用法及代码示例
- Python sklearn plot_tree用法及代码示例
- Python sklearn plot_partial_dependence用法及代码示例
- Python sklearn power_transform用法及代码示例
- Python sklearn parallel_backend用法及代码示例
- Python sklearn pairwise_distances_chunked用法及代码示例
- Python sklearn permutation_importance用法及代码示例
- Python sklearn partial_dependence用法及代码示例
- Python sklearn parametrize_with_checks用法及代码示例
- Python sklearn pair_confusion_matrix用法及代码示例
- Python sklearn precision_score用法及代码示例
- Python sklearn precision_recall_fscore_support用法及代码示例
- Python sklearn polynomial_kernel用法及代码示例
- Python sklearn paired_distances用法及代码示例
- Python sklearn precision_recall_curve用法及代码示例
- Python sklearn jaccard_score用法及代码示例
- Python sklearn WhiteKernel用法及代码示例
- Python sklearn CalibrationDisplay.from_predictions用法及代码示例
- Python sklearn VotingRegressor用法及代码示例
- Python sklearn gen_batches用法及代码示例
- Python sklearn ExpSineSquared用法及代码示例
- Python sklearn MDS用法及代码示例
- Python sklearn adjusted_rand_score用法及代码示例
- Python sklearn MLPClassifier用法及代码示例
注:本文由纯净天空筛选整理自scikit-learn.org大神的英文原创作品 sklearn.metrics.plot_det_curve。非经特殊声明,原始代码版权归原作者所有,本译文未经允许或授权,请勿转载或复制。