本文简要介绍python语言中 sklearn.calibration.CalibrationDisplay.from_predictions 的用法。
用法:
classmethod from_predictions(y_true, y_prob, *, n_bins=5, strategy='uniform', name=None, ref_line=True, ax=None, **kwargs)使用真实标签和预测概率绘制校准曲线。
校准曲线,也称为可靠性图,使用来自二元分类器的输入,并在 y 轴上绘制每个 bin 的平均预测概率与正类的比例。
额外的关键字参数将传递给
matplotlib.pyplot.plot。在用户指南中阅读有关校准的更多信息,并在 Visualizations 中阅读有关 scikit-learn 可视化 API 的更多信息。
- y_true:形状类似数组 (n_samples,)
真正的标签。
- y_prob:形状类似数组 (n_samples,)
正类的预测概率。
- n_bins:整数,默认=5
计算校准曲线时将 [0, 1] 区间离散化为的 bin 数。更大的数字需要更多的数据。
- strategy:{‘uniform’, ‘quantile’},默认='uniform'
用于定义 bin 宽度的策略。
'uniform':箱子具有相同的宽度。'quantile':bin 具有相同数量的样本并取决于预测概率。
- name:str,默认=无
标记曲线的名称。
- ref_line:布尔,默认=真
如果
True,绘制代表完美校准分类器的参考线。- ax:matplotlib 轴,默认=无
要绘制的轴对象。如果
None,则创建一个新的图形和轴。- **kwargs:dict
要传递给
matplotlib.pyplot.plot的关键字参数。
- display:
CalibrationDisplay。 存储计算值的对象。
- display:
参数:
返回:
例子:
>>> import matplotlib.pyplot as plt
>>> from sklearn.datasets import make_classification
>>> from sklearn.model_selection import train_test_split
>>> from sklearn.linear_model import LogisticRegression
>>> from sklearn.calibration import CalibrationDisplay
>>> X, y = make_classification(random_state=0)
>>> X_train, X_test, y_train, y_test = train_test_split(
...     X, y, random_state=0)
>>> clf = LogisticRegression(random_state=0)
>>> clf.fit(X_train, y_train)
LogisticRegression(random_state=0)
>>> y_prob = clf.predict_proba(X_test)[:, 1]
>>> disp = CalibrationDisplay.from_predictions(y_test, y_prob)
>>> plt.show()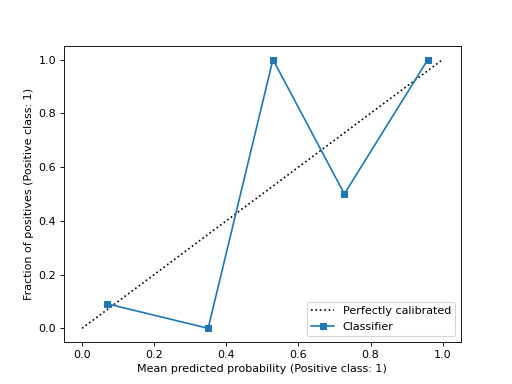
相关用法
- Python sklearn CalibrationDisplay.from_estimator用法及代码示例
- Python sklearn CalibrationDisplay用法及代码示例
- Python sklearn CalibratedClassifierCV用法及代码示例
- Python sklearn CategoricalNB用法及代码示例
- Python sklearn ConfusionMatrixDisplay.from_predictions用法及代码示例
- Python sklearn ClassifierChain用法及代码示例
- Python sklearn ComplementNB用法及代码示例
- Python sklearn CountVectorizer用法及代码示例
- Python sklearn ConfusionMatrixDisplay用法及代码示例
- Python sklearn CompoundKernel用法及代码示例
- Python sklearn ConstantKernel用法及代码示例
- Python sklearn ConfusionMatrixDisplay.from_estimator用法及代码示例
- Python sklearn ColumnTransformer用法及代码示例
- Python sklearn CCA用法及代码示例
- Python sklearn jaccard_score用法及代码示例
- Python sklearn WhiteKernel用法及代码示例
- Python sklearn VotingRegressor用法及代码示例
- Python sklearn gen_batches用法及代码示例
- Python sklearn ExpSineSquared用法及代码示例
- Python sklearn MDS用法及代码示例
- Python sklearn adjusted_rand_score用法及代码示例
- Python sklearn MLPClassifier用法及代码示例
- Python sklearn train_test_split用法及代码示例
- Python sklearn RandomTreesEmbedding用法及代码示例
- Python sklearn GradientBoostingRegressor用法及代码示例
注:本文由纯净天空筛选整理自scikit-learn.org大神的英文原创作品 sklearn.calibration.CalibrationDisplay.from_predictions。非经特殊声明,原始代码版权归原作者所有,本译文未经允许或授权,请勿转载或复制。