用法:
DataFrame.plot.scatter(x, y, s=None, c=None, **kwargs)创建具有不同标记点大小和颜色的散点图。
每个点的坐标由两个 DataFrame 列定义,实心圆圈用于表示每个点。这种图对于查看两个变量之间的复杂相关性很有用。例如,点可以是自然 2D 坐标,如Map中的经度和纬度,或者通常是可以相互绘制的任何一对度量。
- x:整数或字符串
用作每个点的水平坐标的列名或列位置。
- y:整数或字符串
用作每个点的垂直坐标的列名或列位置。
- s:str,标量或array-like,可选
每个点的大小。可能的值为:
带有用于标记大小的列名称的字符串。
单个标量,因此所有点的大小相同。
一系列标量,将递归地用于每个点的大小。例如,当通过 [2,14] 时,所有点的大小将是 2 或 14,或者。
- c:str、int 或 array-like,可选
每个点的颜色。可能的值为:
由名称、RGB 或 RGBA 代码引用的单一颜色字符串,例如 ‘red’ 或“#a98d19”。
由名称、RGB 或 RGBA 代码引用的一系列颜色字符串,将递归地用于每个点的颜色。例如 [‘green’,'yellow'] 所有点将交替填充为绿色或黄色。
列名称或位置,其值将用于根据颜色图为标记点着色。
- **kwargs:
要传递给
DataFrame.plot()的关键字参数。
matplotlib.axes.Axes或它们的 numpy.ndarray
参数:
返回:
例子:
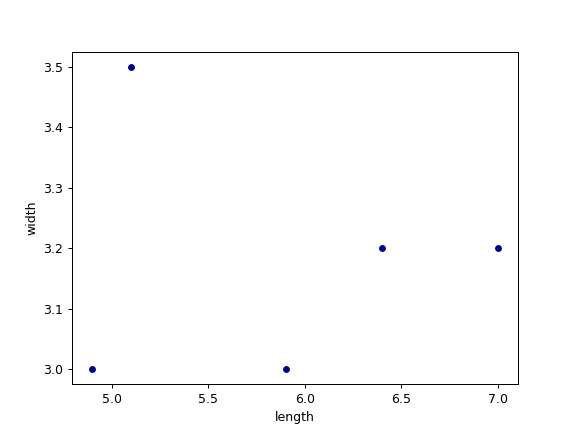
让我们看看如何使用 DataFrame 列中值的坐标绘制散点图。
>>> df = pd.DataFrame([[5.1, 3.5, 0], [4.9, 3.0, 0], [7.0, 3.2, 1],
...                    [6.4, 3.2, 1], [5.9, 3.0, 2]],
...                   columns=['length', 'width', 'species'])
>>> ax1 = df.plot.scatter(x='length',
...                       y='width',
...                       c='DarkBlue')
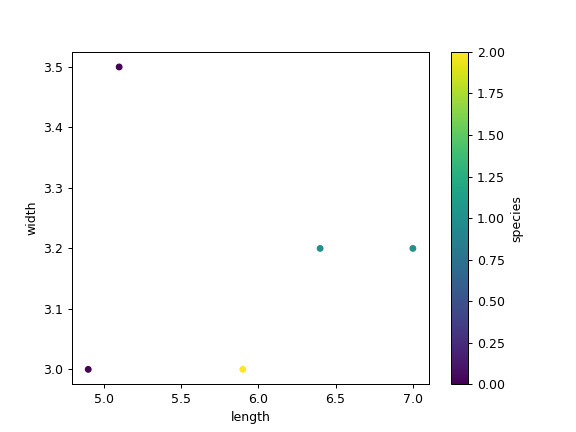
现在,颜色也由列确定。
>>> ax2 = df.plot.scatter(x='length',
...                       y='width',
...                       c='species',
...                       colormap='viridis')
相关用法
- Python pandas.DataFrame.plot.hexbin用法及代码示例
- Python pandas.DataFrame.plot.barh用法及代码示例
- Python pandas.DataFrame.plot.kde用法及代码示例
- Python pandas.DataFrame.plot.box用法及代码示例
- Python pandas.DataFrame.plot.area用法及代码示例
- Python pandas.DataFrame.plot.bar用法及代码示例
- Python pandas.DataFrame.plot.hist用法及代码示例
- Python pandas.DataFrame.plot.pie用法及代码示例
- Python pandas.DataFrame.plot.density用法及代码示例
- Python pandas.DataFrame.plot.line用法及代码示例
- Python pandas.DataFrame.product用法及代码示例
- Python pandas.DataFrame.prod用法及代码示例
- Python pandas.DataFrame.pivot用法及代码示例
- Python pandas.DataFrame.pipe用法及代码示例
- Python pandas.DataFrame.pivot_table用法及代码示例
- Python pandas.DataFrame.pop用法及代码示例
- Python pandas.DataFrame.pow用法及代码示例
- Python pandas.DataFrame.pct_change用法及代码示例
- Python pandas.DataFrame.ewm用法及代码示例
- Python pandas.DataFrame.dot用法及代码示例
注:本文由纯净天空筛选整理自pandas.pydata.org大神的英文原创作品 pandas.DataFrame.plot.scatter。非经特殊声明,原始代码版权归原作者所有,本译文未经允许或授权,请勿转载或复制。
