用法:
DataFrame.plot.pie(**kwargs)生成饼图。
饼图是列中数值数据的比例表示。此函数为指定列包装
matplotlib.pyplot.pie()。如果没有传递列引用并且subplots=True为每个数字列独立绘制饼图。- y:整数或标签,可选
要绘制的列的标签或位置。如果未提供,则必须传递
subplots=True参数。- **kwargs:
要传递给
DataFrame.plot()的关键字参数。
- matplotlib.axes.Axes 或它们的 np.ndarray
当
subplots为 True 时,返回一个 NumPy 数组。
参数:
返回:
例子:
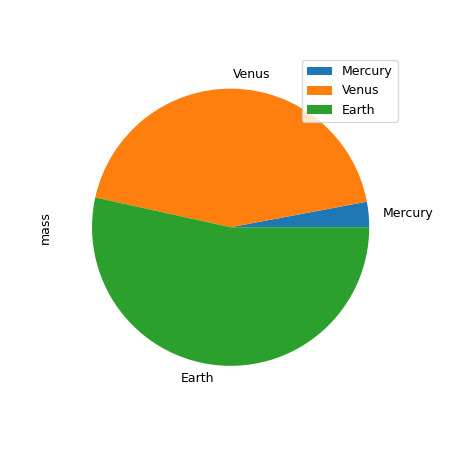
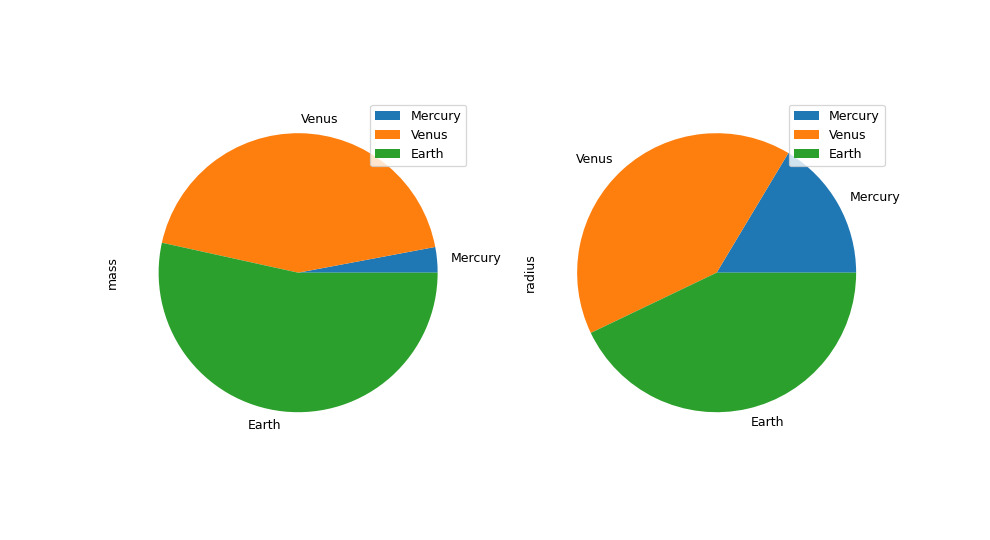
在下面的示例中,我们有一个 DataFrame,其中包含有关行星质量和半径的信息。我们将‘mass’ 列传递给饼函数以获得饼图。
>>> df = pd.DataFrame({'mass': [0.330, 4.87 , 5.97],
...                    'radius': [2439.7, 6051.8, 6378.1]},
...                   index=['Mercury', 'Venus', 'Earth'])
>>> plot = df.plot.pie(y='mass', figsize=(5, 5))
>>> plot = df.plot.pie(subplots=True, figsize=(11, 6))
相关用法
- Python pandas.DataFrame.plot.hexbin用法及代码示例
- Python pandas.DataFrame.plot.barh用法及代码示例
- Python pandas.DataFrame.plot.kde用法及代码示例
- Python pandas.DataFrame.plot.box用法及代码示例
- Python pandas.DataFrame.plot.area用法及代码示例
- Python pandas.DataFrame.plot.scatter用法及代码示例
- Python pandas.DataFrame.plot.bar用法及代码示例
- Python pandas.DataFrame.plot.hist用法及代码示例
- Python pandas.DataFrame.plot.density用法及代码示例
- Python pandas.DataFrame.plot.line用法及代码示例
- Python pandas.DataFrame.product用法及代码示例
- Python pandas.DataFrame.prod用法及代码示例
- Python pandas.DataFrame.pivot用法及代码示例
- Python pandas.DataFrame.pipe用法及代码示例
- Python pandas.DataFrame.pivot_table用法及代码示例
- Python pandas.DataFrame.pop用法及代码示例
- Python pandas.DataFrame.pow用法及代码示例
- Python pandas.DataFrame.pct_change用法及代码示例
- Python pandas.DataFrame.ewm用法及代码示例
- Python pandas.DataFrame.dot用法及代码示例
注:本文由纯净天空筛选整理自pandas.pydata.org大神的英文原创作品 pandas.DataFrame.plot.pie。非经特殊声明,原始代码版权归原作者所有,本译文未经允许或授权,请勿转载或复制。
