Python是进行数据分析的一种出色语言,主要是因为以数据为中心的python软件包具有奇妙的生态系统。 Pandas是其中的一种,使导入和分析数据更加容易。
Pandas dataframe.corr()用于查找数据帧中所有列的成对相关性。任何na值会自动排除。对于 DataFrame 中的任何非数字数据类型列,将忽略该列。
用法: DataFrame.count(axis=0, level=None, numeric_only=False)
参数:
method:
pearson :标准相关系数
kendall :Kendall Tau相关系数
spearman :矛兵等级相关
min_periods:每对列必须具有有效结果的最小观察数。目前仅适用于皮尔逊和斯皮尔曼相关
返回:count:y:DataFrame
注意:变量与自身的相关性为1。
有关在代码中使用的CSV文件的链接,请单击此处
范例1:采用corr()函数可以使用“皮尔逊”方法在 DataFrame 中的各列之间找到相关性。
# importing pandas as pd
import pandas as pd

# Making data frame from the csv file
df = pd.read_csv("nba.csv")

# Printing the first 10 rows of the data frame for visualization
df[:10]
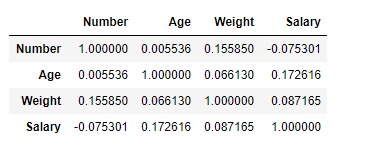
现在使用corr()函数查找列之间的相关性。 DataFrame 中只有四个数字列。
# To find the correlation among
# the columns using pearson method
df.corr(method ='pearson')
输出:

可以将输出数据帧解释为任何单元格,与列变量相关的行变量是该单元格的值。如前所述,变量与自身的相关性为1。因此,所有对角线值均为1.00
范例2:采用corr()函数使用“ kendall”方法在 DataFrame 中的各列之间找到相关性。
# importing pandas as pd
import pandas as pd

# Making data frame from the csv file
df = pd.read_csv("nba.csv")

# To find the correlation among
# the columns using kendall method
df.corr(method ='kendall')
输出:

可以将输出数据帧解释为任何单元格,与列变量相关的行变量是该单元格的值。如前所述,变量与自身的相关性为1。因此,所有对角线值均为1.00。
相关用法
- Python pandas.map()用法及代码示例
- Python Pandas Timestamp.tz用法及代码示例
- Python Pandas Series.str.contains()用法及代码示例
- Python Pandas dataframe.std()用法及代码示例
- Python Pandas Timestamp.dst用法及代码示例
- Python Pandas dataframe.sem()用法及代码示例
- Python Pandas DataFrame.ix[ ]用法及代码示例
- Python Pandas.Categorical()用法及代码示例
- Python Pandas.apply()用法及代码示例
- Python Pandas TimedeltaIndex.contains用法及代码示例
- Python Pandas Timestamp.now用法及代码示例
- Python Pandas Series.str.pad()用法及代码示例
- Python Pandas Series.take()用法及代码示例
- Python Pandas dataframe.all()用法及代码示例
- Python Pandas series.str.get()用法及代码示例
注:本文由纯净天空筛选整理自Shubham__Ranjan大神的英文原创作品 Python | Pandas dataframe.corr()。非经特殊声明,原始代码版权归原作者所有,本译文未经允许或授权,请勿转载或复制。
