Python是進行數據分析的一種出色語言,主要是因為以數據為中心的python軟件包具有奇妙的生態係統。 Pandas是其中的一種,使導入和分析數據更加容易。
Pandas dataframe.corr()用於查找數據幀中所有列的成對相關性。任何na值會自動排除。對於 DataFrame 中的任何非數字數據類型列,將忽略該列。
用法: DataFrame.count(axis=0, level=None, numeric_only=False)
參數:
method:
pearson :標準相關係數
kendall :Kendall Tau相關係數
spearman :矛兵等級相關
min_periods:每對列必須具有有效結果的最小觀察數。目前僅適用於皮爾遜和斯皮爾曼相關
返回:count:y:DataFrame
注意:變量與自身的相關性為1。
有關在代碼中使用的CSV文件的鏈接,請單擊此處
範例1:采用corr()函數可以使用“皮爾遜”方法在 DataFrame 中的各列之間找到相關性。
# importing pandas as pd
import pandas as pd

# Making data frame from the csv file
df = pd.read_csv("nba.csv")

# Printing the first 10 rows of the data frame for visualization
df[:10]
現在使用corr()函數查找列之間的相關性。 DataFrame 中隻有四個數字列。
# To find the correlation among
# the columns using pearson method
df.corr(method ='pearson')
輸出:
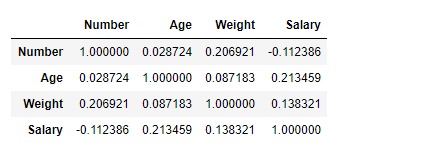
可以將輸出數據幀解釋為任何單元格,與列變量相關的行變量是該單元格的值。如前所述,變量與自身的相關性為1。因此,所有對角線值均為1.00
範例2:采用corr()函數使用“ kendall”方法在 DataFrame 中的各列之間找到相關性。
# importing pandas as pd
import pandas as pd

# Making data frame from the csv file
df = pd.read_csv("nba.csv")

# To find the correlation among
# the columns using kendall method
df.corr(method ='kendall')
輸出:
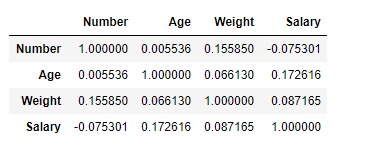
可以將輸出數據幀解釋為任何單元格,與列變量相關的行變量是該單元格的值。如前所述,變量與自身的相關性為1。因此,所有對角線值均為1.00。
相關用法
- Python pandas.map()用法及代碼示例
- Python Pandas Timestamp.tz用法及代碼示例
- Python Pandas Series.str.contains()用法及代碼示例
- Python Pandas dataframe.std()用法及代碼示例
- Python Pandas Timestamp.dst用法及代碼示例
- Python Pandas dataframe.sem()用法及代碼示例
- Python Pandas DataFrame.ix[ ]用法及代碼示例
- Python Pandas.Categorical()用法及代碼示例
- Python Pandas.apply()用法及代碼示例
- Python Pandas TimedeltaIndex.contains用法及代碼示例
- Python Pandas Timestamp.now用法及代碼示例
- Python Pandas Series.str.pad()用法及代碼示例
- Python Pandas Series.take()用法及代碼示例
- Python Pandas dataframe.all()用法及代碼示例
- Python Pandas series.str.get()用法及代碼示例
注:本文由純淨天空篩選整理自Shubham__Ranjan大神的英文原創作品 Python | Pandas dataframe.corr()。非經特殊聲明,原始代碼版權歸原作者所有,本譯文未經允許或授權,請勿轉載或複製。