arrows()R语言中的函数用于在指定图形上的点之间创建箭头。
用法: arrows(x0, y0, x1, y1, length)
参数:
x0:表示绘制箭头的点的 x 坐标
y0:表示绘制箭头的点的 y 坐标
x1:表示绘制箭头的点的 x 坐标
y1:表示绘制箭头的点的 y 坐标
length:表示箭头边的长度(以英寸为单位)
范例1:
# Specifying points
x0 <- 1
y0 <- 1
x1 <- 5
y1 <- 5
x <- c(x0, x1)
y <- c(y0, y1)

# Output to be present as PNG file
png(file = "arrows1GFG.png")

# Create plot graph
plot(x, y, main = "Arrows Function")

# Create arrow between the points
arrows(x0, y0, x1, y1)

# Saving the file
dev.off()
输出:
范例2:
# Specifying points
x <- runif(10, 0, 1)
y <- runif(10, 1, 5)

# Output to be present as PNG file
png(file = "arrows2GFG.png")

# Create plot graph
plot(x, y, main = "Arrows Function")

# Create arrow between the points
s <- seq(length(x) - 1)
arrows(x[s], y[s], x[s + 1], y[s + 1])

# Saving the file
dev.off()
输出: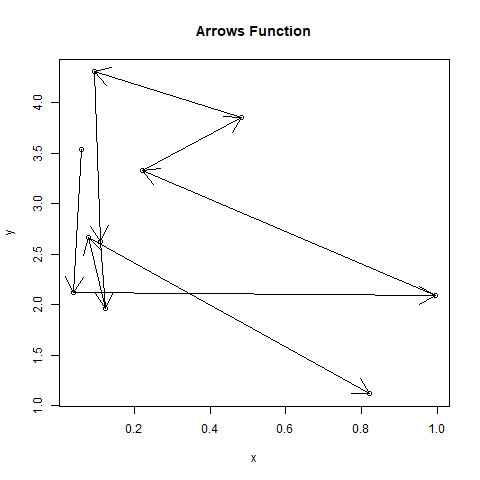
相关用法
- R语言 points()用法及代码示例
- R语言 dgeom()用法及代码示例
- R语言 segments()用法及代码示例
- R语言 polygon()用法及代码示例
- R语言 lines()用法及代码示例
- R语言 pairs()用法及代码示例
- R语言 axis()用法及代码示例
- R语言 abline()用法及代码示例
- R语言 plot()用法及代码示例
- R语言 title()用法及代码示例
- R语言 between()用法及代码示例
注:本文由纯净天空筛选整理自utkarsh_kumar大神的英文原创作品 Plot Arrows Between Points in a Graph in R Programming – arrows() Function。非经特殊声明,原始代码版权归原作者所有,本译文未经允许或授权,请勿转载或复制。