plot() 函数被定义为 R 语言绘图的通用函数。它可用于创建不同类型的基本图形。
用法:
plot(x, y, type)
参数:
x and y:要绘制的点坐标
type:要创建的图形类型
返回:不同类型的地块
范例1:
# R program to plot a graph

# Values for x and y axis
x <- 1:5; y = x * x

# Using plot() function
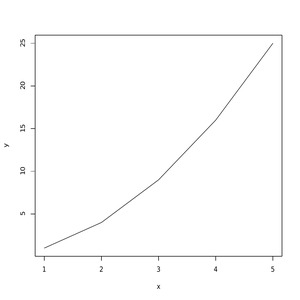
plot(x, y, type = "l")
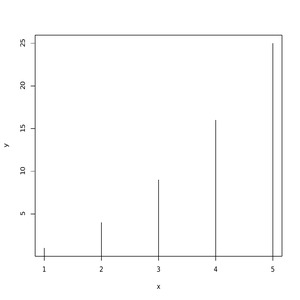
plot(x, y, type = "h")在上面的例子中 type=“l” 代表线图,type=“h” 代表 ‘histogram’ 就像垂直线。
范例2:
# R program to plot a graph

# Creating x and y-values
x - 1:5; y = x * x

# Using plot function
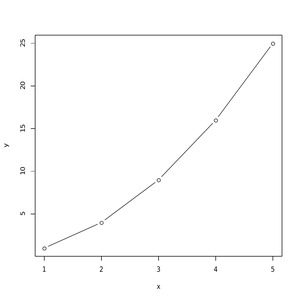
plot(x, y, type = "b")
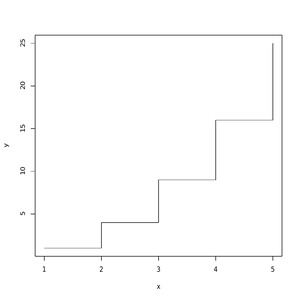
plot(x, y, type = "s")
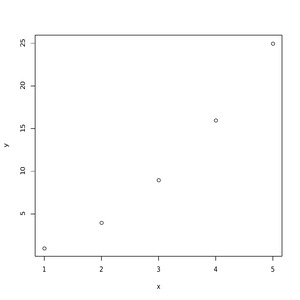
plot(x, y, type = "p")在这里,在上面的例子中 type=“b” 代表两者,这意味着点由一条线连接
type=“s” 表示楼梯台阶
type=“p” 表示点(默认情况下)。
相关用法
- R语言 persp()用法及代码示例
- R语言 points()用法及代码示例
- R语言 lines()用法及代码示例
- R语言 arrows()用法及代码示例
- R语言 dgeom()用法及代码示例
- R语言 pairs()用法及代码示例
- R语言 axis()用法及代码示例
- R语言 abline()用法及代码示例
- R语言 data.matrix()用法及代码示例
- R语言 with()用法及代码示例
- R语言 sample()用法及代码示例
注:本文由纯净天空筛选整理自kaurbal1698大神的英文原创作品 Plotting of Data using Generic plots in R Programming – plot() Function。非经特殊声明,原始代码版权归原作者所有,本译文未经允许或授权,请勿转载或复制。

