lines()R 语言中的函数用于向现有绘图添加不同类型、颜色和宽度的线条。
用法: lines(x, y, col, lwd, lty)
参数:
x, y:坐标向量
col:线条颜色
lwd:线宽
lty:线路类型
样本散点图:
# R program to create a scatter plot

# Creating coordinate vectors
x <- c(1.3, 3.5, 1.4, -3.1, 5.7, 2.4, 3.3, 2.5, 2.3, 1.9, 1.8, 2.3)
y <- c(2.5, 5.8, 2.1, -3, 12, 5, 6.2, 4.8, 4.2, 3.5, 3.7, 5.2)

# Plotting the graph
plot(x, y, cex = 1, pch = 3, xlab ="x", ylab ="y", col ="black")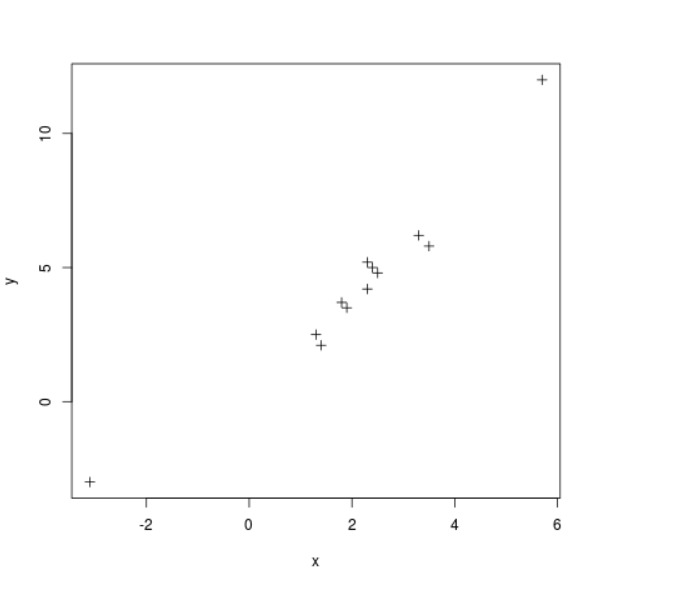
范例1:
# R program to add lines into plots

# Creating coordinate vectors
x <- c(1.3, 3.5, 1.4, -3.1, 5.7, 2.4, 3.3, 2.5, 2.3, 1.9, 1.8, 2.3)
y <- c(2.5, 5.8, 2.1, -3, 12, 5, 6.2, 4.8, 4.2, 3.5, 3.7, 5.2)

# Plotting the graph
plot(x, y, cex = 1, pch = 3, xlab ="x", ylab ="y", col ="black")

# Creating coordinate vectors
x2 <- c(4.3, 1.2, -2.5, -0.4)
y2 <- c(3.5, 4.6, 2.5, 3.2)

# Plotting a line
lines(x2, y2, col = "red", lwd = 2, lty = 1)
输出: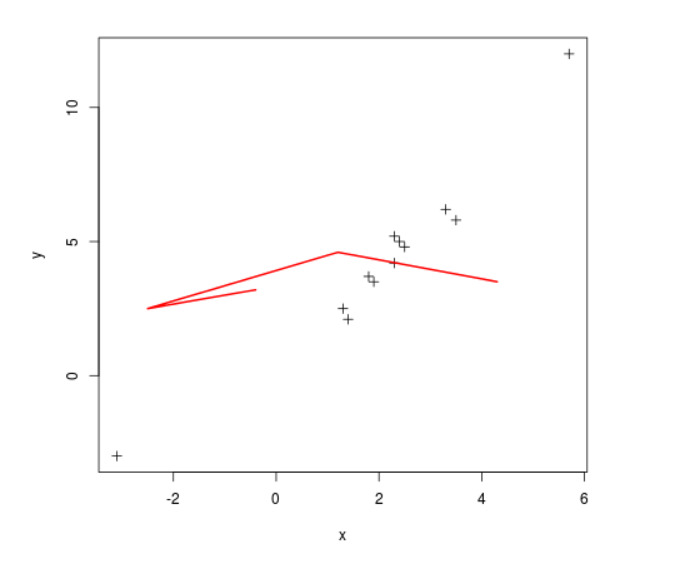
范例2:
# R program to add lines into plots

# Creating coordinate vectors
x <- c(1.3, 3.5, 1.4, -3.1, 5.7, 2.4, 3.3, 2.5, 2.3, 1.9, 1.8, 2.3)
y <- c(2.5, 5.8, 2.1, -3, 12, 5, 6.2, 4.8, 4.2, 3.5, 3.7, 5.2)

# Plotting the graph
plot(x, y, cex = 1, pch = 3, xlab ="x", ylab ="y", col ="black")

# Creating coordinate vectors
x2 <- c(2, 3, 4, 5)
y2 <- c(2, 3, 4, 5)

# Plotting a line
lines(x2, y2, col = "red", lwd = 3, lty = 2)
输出: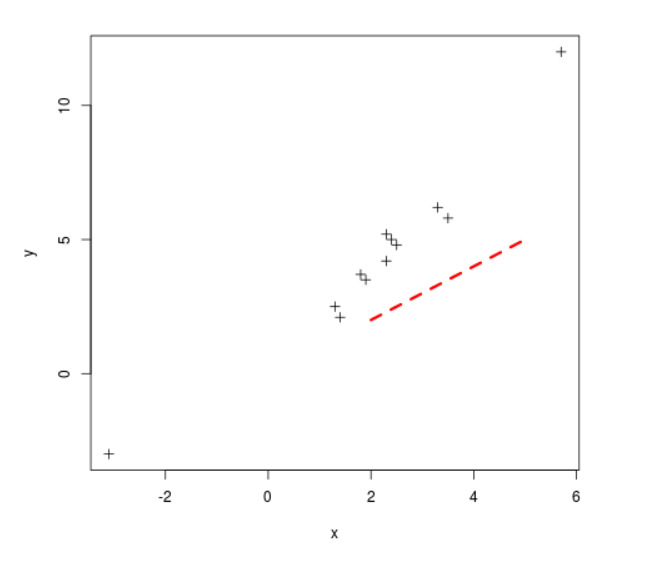
相关用法
- R语言 points()用法及代码示例
- R语言 abline()用法及代码示例
- R语言 sum()用法及代码示例
- R语言 arrows()用法及代码示例
- R语言 dgeom()用法及代码示例
- R语言 pairs()用法及代码示例
- R语言 axis()用法及代码示例
- R语言 plot()用法及代码示例
- R语言 readLines()用法及代码示例
- R语言 is.primitive()用法及代码示例
- R语言 dunif()用法及代码示例
- R语言 lapply()用法及代码示例
注:本文由纯净天空筛选整理自nidhi_biet大神的英文原创作品 Addition of Lines to a Plot in R Programming – lines() Function。非经特殊声明,原始代码版权归原作者所有,本译文未经允许或授权,请勿转载或复制。