R 语言中的 segment() 函数用于在特定点之间绘制线段。
用法: segments(x0, y0, x1, y1)
参数:
x, y:坐标以在提供的点之间绘制线段。
返回:给定点之间的线段
范例1:绘制单个线段
# Create empty example plot
plot(0, 0, col = "white", xlab = "", ylab = "")

# Draw one line
segments(x0 = - 1, y0 = - 0.5, x1 = 0.5, y1 = 0, col = "darkgreen")
输出: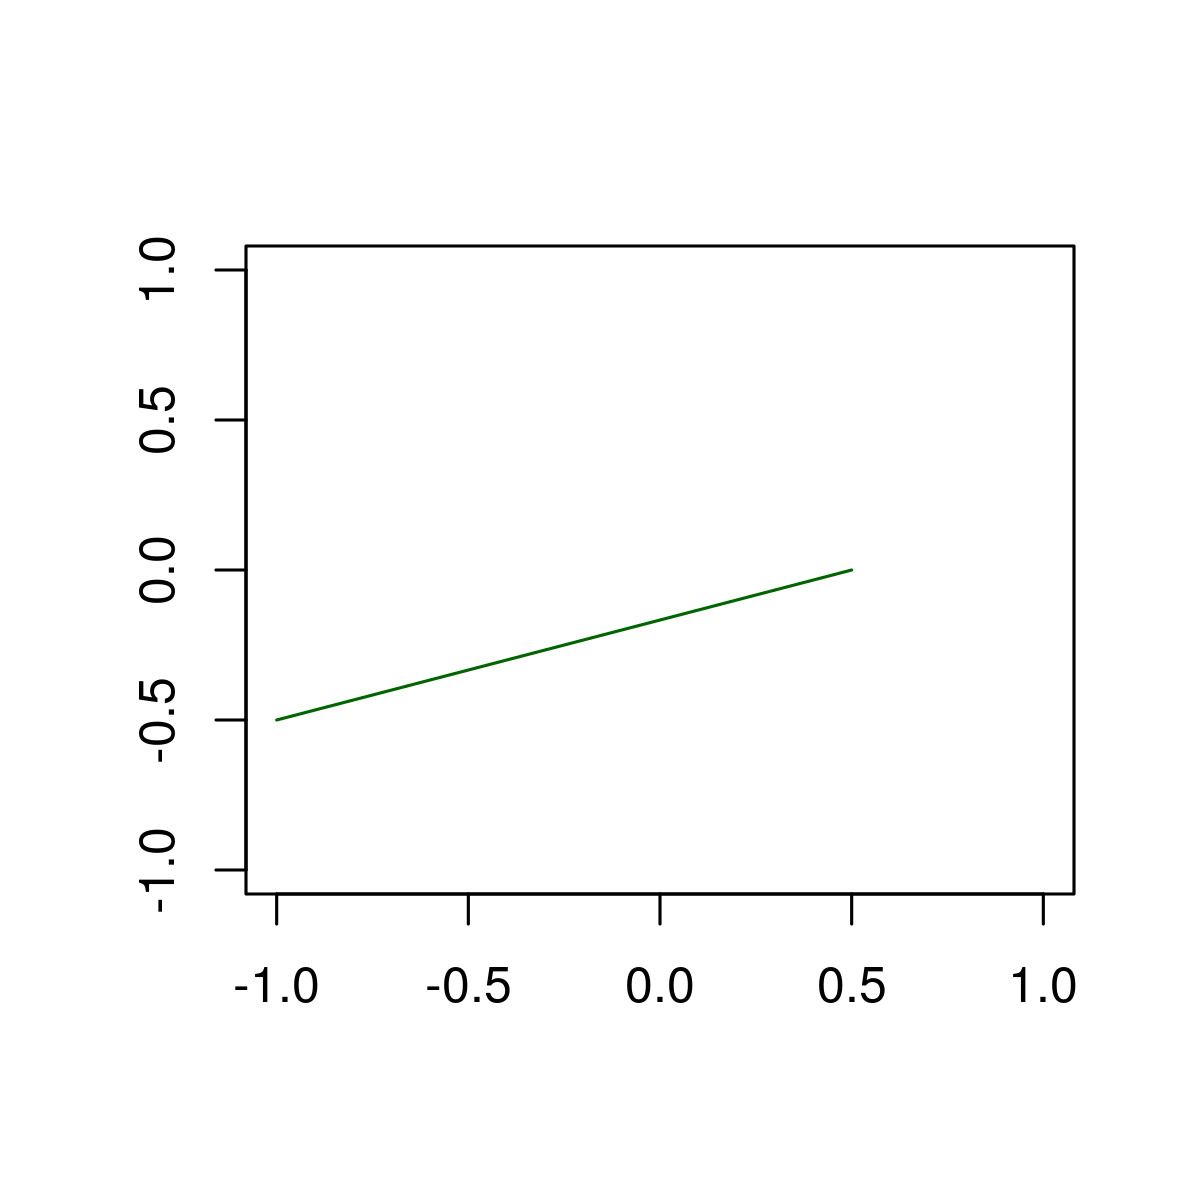
这里,x0 & y0 是线段的起点,x1 & y1 是线段的终点。
范例2:修改颜色、粗细和线型
# Create empty example plot
plot(0, 0, col = "white", xlab = "", ylab = "")

# Draw one line as in Example 1
segments(x0 = - 1, y0 = - 1, x1 = 0.5, y1 = 0.5,

         # Color of line
         col = "darkgreen",

         # Thickness of line
         lwd = 5,

         # Line type
         lty = "dotted")
输出: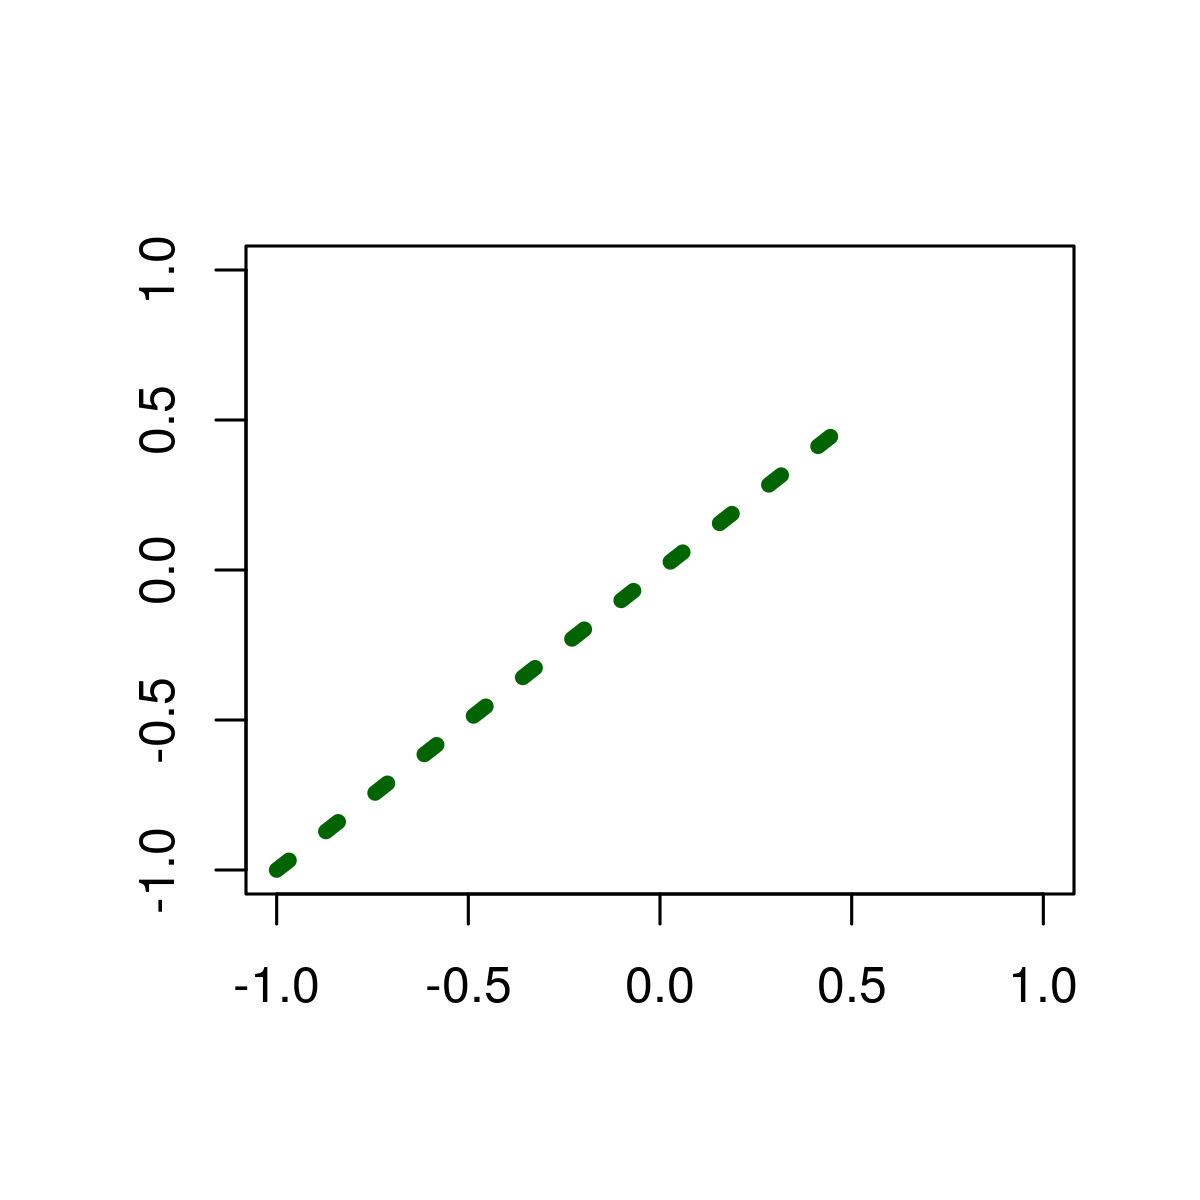
范例3:绘制多条线段到 R Plot。
# Create empty example plot
plot(0, 0, col = "white", xlab = "", ylab = "")

# Create data frame with line-values
multiple_segments <- data.frame(x0 = c(0.1, 0.2, - 0.7, 0.4, - 0.8),
                       y0 = c(0.8, 0.3, 0.5, - 0.4, 0.3),
                       x1 = c(0, 0.4, 0.5, - 0.5, - 0.7),
                       y1 = c(- 0.3, 0.4, - 0.5, - 0.7, 0.8))

 # Draw multiple lines
 segments(x0 = multiple_segments$x0,
         y0 = multiple_segments$y0,
         x1 = multiple_segments$x1,
         y1 = multiple_segments$y1)
输出: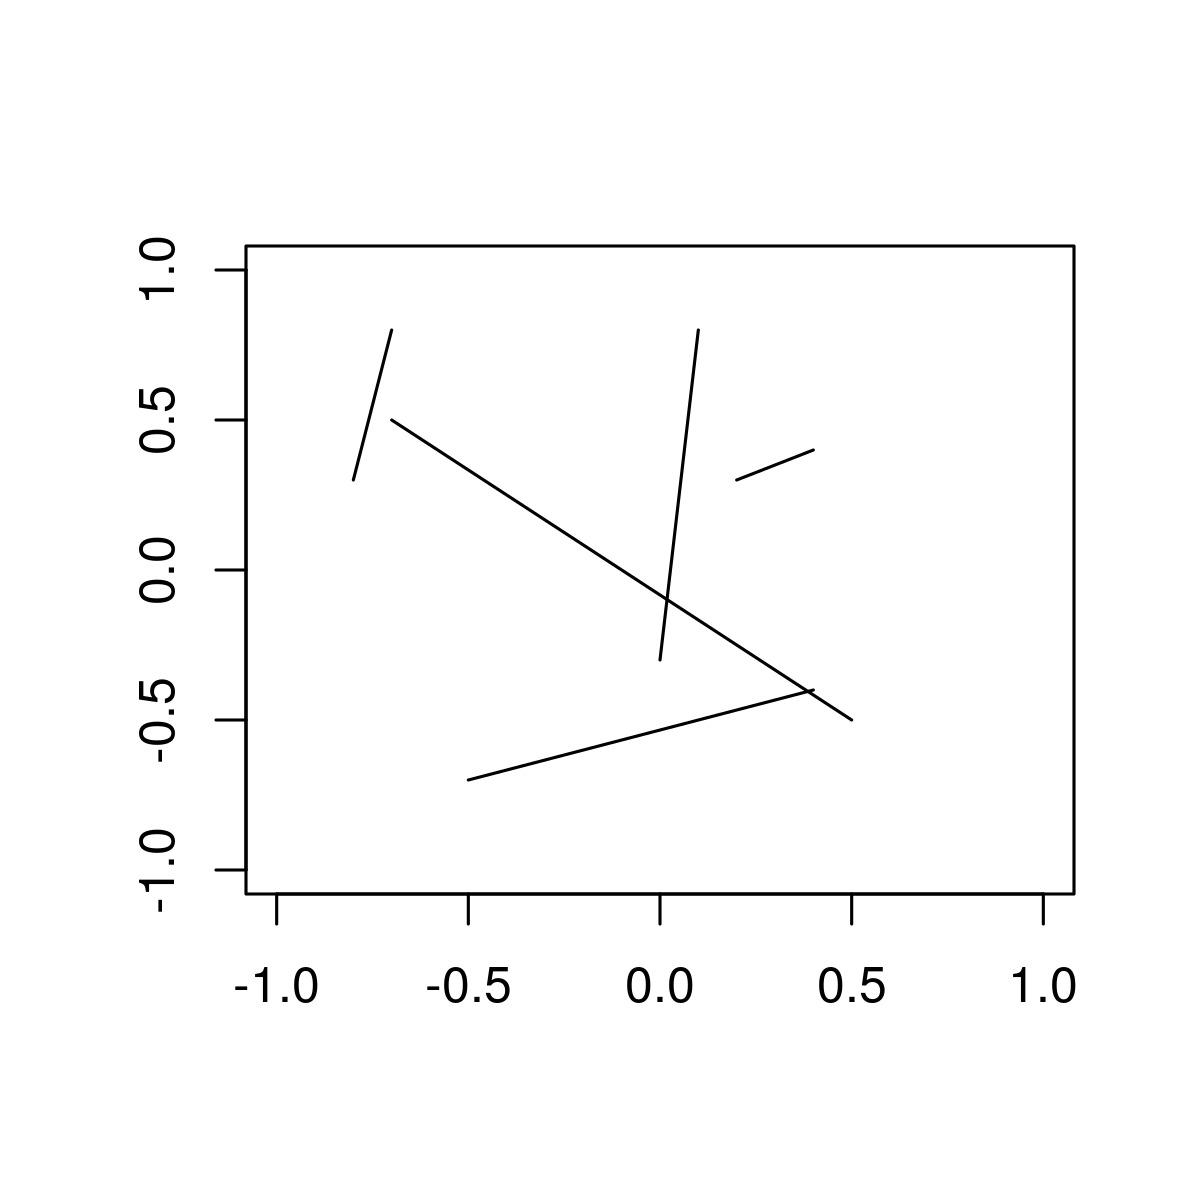
相关用法
- R语言 polygon()用法及代码示例
- R语言 points()用法及代码示例
- R语言 arrows()用法及代码示例
- R语言 curve()用法及代码示例
- R语言 between()用法及代码示例
注:本文由纯净天空筛选整理自kaurbal1698大神的英文原创作品 Draw Line Segments between Particular Points in R Programming – segments() Function。非经特殊声明,原始代码版权归原作者所有,本译文未经允许或授权,请勿转载或复制。