R 语言中的 polygon() 函数用于在现有绘图中的指定点之间绘制多边形。
用法: polygon(x_coordinates, y_coordinates)
参数:
x_coordinates, y_coordinates:绘制多边形的图的 x, y 坐标
返回:给定图中的多边形
范例1:在 R 图中绘制方形多边形
# R program to draw a polygon

# Draw an empty plot
plot(2, 2, col = "white", xlab = "X", ylab = "Y")

# Draw a polygon
polygon(x = c(2.7, 2.3, 2.2, 2.8),  # X-Coordinates of polygon
        y = c(2.6, 2.8, 2.4, 2),    # Y-Coordinates of polygon
        col = "darkgreen")
输出: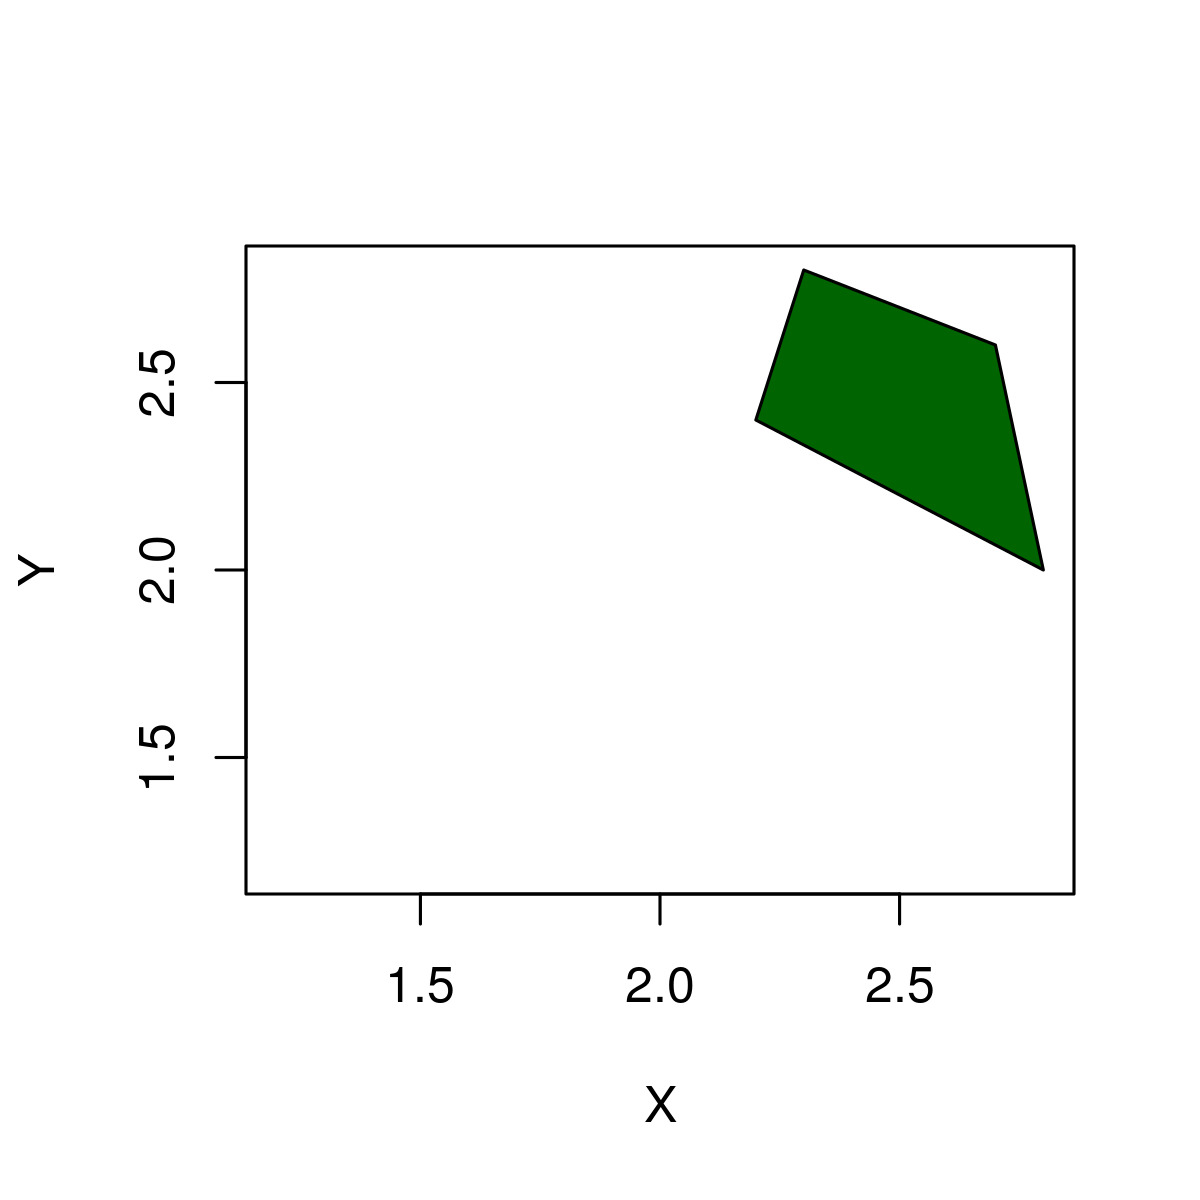
范例2:多边形的颜色边界
# R program to draw a polygon

# Draw empty plot
plot(2, 2, col = "white", xlab = "X", ylab = "Y")

# Draw a polygon
polygon(x = c(2.7, 2.3, 2.2, 2.8),  # X-Coordinates of polygon
        y = c(2.6, 2.8, 2.4, 2),    # Y-Coordinates of polygon
        col = "darkgreen",          # Color of polygon
        border = "red",             # Color of polygon border
        lwd = 8)                    # Thickness of border
输出:
这里,border 指定边框颜色,lwd 指定边框粗细。
范例3:绘制频率多边形
# R program to draw a polygon

# X values for frequency polygon
x1 <- 1:10

# Y values for frequency polygon
y1 <- c(2, 4, 7, 4, 5, 8, 6, 6, 1, 2)

# Plot frequency polygon
plot(x1, y1,
     type = "l",     # Set line type to line
     lwd = 4)         # Thickness of line

# X-Y-Coordinates of polygon
polygon(c(1, x1, 10), c(0, y1, 0),
        col = "darkgreen")   # Color of polygon

# Add squares to frequency polygon
points(x1, y1,
       cex = 1,    # Size of squares
       pch = 12)
       segments(x1, 0, x1, y1)
输出:
范例4:在密度以下绘制多边形
# R program to draw a polygon

# Set seed for reproducibility
set.seed(15000)

# Sample size
N <- 1000

# Draw random poisson distribution
x1 <- rpois(N, 2)
plot(density(x1),    # Draw density plot
     main = "",      # No main title
     xlab = "x1")    # Set name of x-axis to x2

# X-Coordinates of polygon
polygon(c(min(density(x1)$x), density(x1)$x),
        c(0, density(x1)$y),     # Y-Coordinates of polygon
        col = "darkgreen")       # Color of polygon
输出:
在这里,上面的例子是用来制作概率密度函数的。
相关用法
- R语言 segments()用法及代码示例
- R语言 points()用法及代码示例
- R语言 colorRampPalette()用法及代码示例
- R语言 arrows()用法及代码示例
- R语言 arrayInd()用法及代码示例
- R语言 word()用法及代码示例
- R语言 get()用法及代码示例
- R语言 curve()用法及代码示例
- R语言 signif()用法及代码示例
- R语言 strtrim()用法及代码示例
- R语言 exists()用法及代码示例
- R语言 gl()用法及代码示例
- R语言 rep_len()用法及代码示例
- R语言 rep.int()用法及代码示例
- R语言 seq_len()用法及代码示例
- R语言 seq.int()用法及代码示例
- R语言 rgb()用法及代码示例
注:本文由纯净天空筛选整理自kaurbal1698大神的英文原创作品 Draw a Polygon between specified points in R Programming – polygon() Function。非经特殊声明,原始代码版权归原作者所有,本译文未经允许或授权,请勿转载或复制。