-
popupTemplatePopupTemplateautocast
PopupTemplate 应用于集群图形。设置后,将使用独立于 layer.popupTemplate 的 popupTemplate。此弹出窗口可以显示集群的摘要信息,包括集群中所有要素的计数以及渲染器映射的字段的平均值或主要值。
要基于图层的渲染器为您的集群配置生成建议的预定义弹出模板,请参阅clusterPopupTemplateCreator。
PopupTemplate 可以包含一个或多个 Arcade 表达式,遵循 Arcade Feature Reduction Popup Profile 定义的规范。表达式必须返回字符串或数字,并且可以使用
$feature和$aggregatedFeatures全局变量访问集群及其聚合特征的数据值。下表说明了集群渲染器内部使用的聚合字段,您可以在集群弹出窗口中引用这些字段。
聚合字段:
字段名称 类型 说明 cluster_countnumber 集群中的特征数量。 cluster_avg_{fieldName}number 对于使用大小、不透明度、连续颜色或分类分隔来可视化数字字段的渲染器,该字段说明了集群中所有要素中渲染字段的平均值。 cluster_type_{fieldName}string 对于具有 UniqueValueRenderer 的图层,此字段说明了集群内所有要素中渲染字段的模式或主要字符串。 以下
popupTemplate配置将显示下图中显示的弹出窗口。簇数
layer.featureReduction = {
  type: "cluster",
  popupTemplate: {
    content: "This cluster represents {cluster_count} earthquakes."
  }
};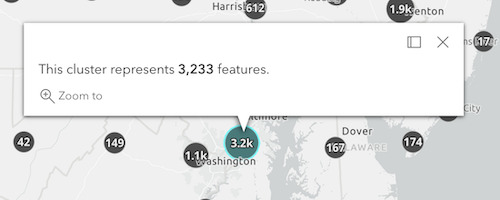
按主要类型划分的集群
以下 featureReduction 配置假定图层的渲染器是 UniqueValueRenderer,其字段名为
religion。layer.featureReduction = { type: "cluster", popupTemplate: { content: [{ type: "text", text: "This cluster represents <b>{cluster_count}</b> features." }, { type: "text", text: "The predominant place of worship in this cluster is <b>{cluster_type_religion}</b>." }] } };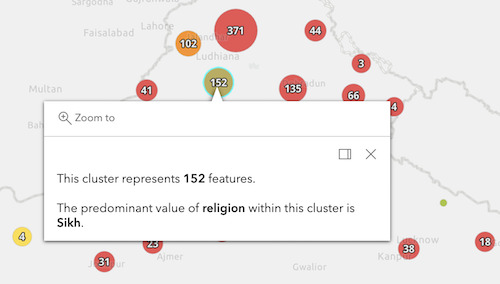
具有视觉变量的集群
以下 featureReduction 配置假定图层的渲染器包含引用名为
WIND_SPEED、WIND_DIRECT、TEMP的字段的视觉变量。layer.featureReduction = { type: "cluster", popupTemplate: { content: [{ type: "text", text: "This cluster represents <b>{cluster_count}</b> weather stations." }, { type: "fields", fieldInfos: [{ fieldName: "cluster_avg_WIND_SPEED", label: "Average wind speed (km/h)", format: { places: 0 } }, { fieldName: "cluster_avg_WIND_DIRECT", label: "Average wind direction (degrees)", format: { places: 0 } }, { fieldName: "cluster_avg_TEMP", label: "Average temperature (°F)", format: { places: 0 } }] }] } };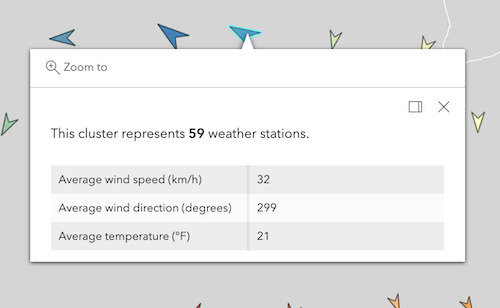
例子:
// enables clustering on the layer with a
// popup describing the number of features represented by each cluster
layer.featureReduction = {
  type: "cluster",
  popupTemplate: {
    content: "This cluster represents <b>{cluster_count}</b> features."
    fieldInfos: [{
      fieldName: "cluster_count",
      format: {
        digitSeparator: true,
        places: 0
      }
    }]
  }
};
// enables clustering on the layer with a // popup describing the average value of // the field mapped by the renderer layer.featureReduction = { type: "cluster", renderer: { type: "simple", symbol: { type: "simple-marker", size: 8 }, label: "Weather stations", visualVariables: [ { type: "color", field: "Temperature", stops: [ { value: 32, color: "blue", label: "< 32° F" }, { value: 90, color: "red", label: ">90° F" } ] } ] }; popupTemplate: { content: [{ type: "text", text: "This cluster represents <b>{cluster_count}</b> features." }, { type: "text", text: "The average temperature in this cluster is <b>{cluster_avg_Temperature}° F</b>." }], fieldInfos: [{ fieldName: "cluster_count", format: { digitSeparator: true, places: 0 } }, { fieldName: "cluster_avg_Temperature", format: { places: 1 } }] } };// Displays an ordered list of the top 5 categories // of features contained within the cluster layer.popupTemplate = { title: "Power plant summary", content: [{ type: "expression", // lists the top 5 most common fuel types in the cluster expressionInfo: { expression: ` Expects($aggregatedFeatures, "fuel1") var statsFS = GroupBy($aggregatedFeatures, [ { name: 'Type', expression: 'fuel1'}, ], [ { name: 'num_features', expression: '1', statistic: 'COUNT' } ] ); var ordered = Top(OrderBy(statsFs, 'num_features DESC'), 5); // create an HTML ordered list as a string and return in a rich text element var list = "<ol>"; for (var group in ordered){ list += \`<li>\${group.Type} (\${Text(group.num_features, "#,###")})</li>\` } list += "</ol>"; return { type: "text", text: list } `, title: "List of fuel types" } }] };
基本信息
以下是所在类或对象的基本信息。
AMD:
require(["esri/layers/support/FeatureReductionCluster"], (FeatureReductionCluster) => { /* code goes here */ });
ESM:
import FeatureReductionCluster from "@arcgis/core/layers/support/FeatureReductionCluster";
类:
esri/layers/support/FeatureReductionCluster
继承: FeatureReductionCluster > Accessor
自从:用于 JavaScript 4.14 的 ArcGIS API
用法说明
FeatureReductionCluster.popupTemplate函数(或属性)的定义如下:
相关用法
- JavaScript ArcGIS FeatureReductionCluster.popupEnabled用法及代码示例
- JavaScript ArcGIS FeatureReductionCluster.clusterMinSize用法及代码示例
- JavaScript ArcGIS FeatureReductionCluster.clusterRadius用法及代码示例
- JavaScript ArcGIS FeatureReductionCluster.type用法及代码示例
- JavaScript ArcGIS FeatureReductionCluster.clusterMaxSize用法及代码示例
- JavaScript ArcGIS FeatureReductionCluster.clone用法及代码示例
- JavaScript ArcGIS FeatureReductionCluster.labelingInfo用法及代码示例
- JavaScript ArcGIS FeatureReductionCluster.labelsVisible用法及代码示例
- JavaScript ArcGIS FeatureReductionCluster用法及代码示例
- JavaScript ArcGIS FeatureReductionSelection用法及代码示例
- JavaScript ArcGIS FeatureReductionSelection.type用法及代码示例
- JavaScript ArcGIS FeatureLayer.queryExtent用法及代码示例
- JavaScript ArcGIS FeatureLayer.when用法及代码示例
- JavaScript FeatureForm.when用法及代码示例
- JavaScript ArcGIS FeatureLayer refresh事件用法及代码示例
- JavaScript ArcGIS FeatureLayer.getFieldDomain用法及代码示例
- JavaScript ArcGIS FeatureLayer.queryFeatureCount用法及代码示例
- JavaScript FeatureForm.getValues用法及代码示例
- JavaScript FeatureForm.visible用法及代码示例
- JavaScript ArcGIS Feature.visible用法及代码示例
- JavaScript ArcGIS FeatureLayer.formTemplate用法及代码示例
- JavaScript ArcGIS Feature用法及代码示例
- JavaScript FeatureForm.classes用法及代码示例
- JavaScript ArcGIS FeatureLayer.relationships用法及代码示例
- JavaScript ArcGIS FeatureLayer.objectIdField用法及代码示例
注:本文由纯净天空筛选整理自arcgis.com大神的英文原创作品 FeatureReductionCluster.popupTemplate。非经特殊声明,原始代码版权归原作者所有,本译文未经允许或授权,请勿转载或复制。