-
popupTemplatePopupTemplateautocast
PopupTemplate 應用於集群圖形。設置後,將使用獨立於 layer.popupTemplate 的 popupTemplate。此彈出窗口可以顯示集群的摘要信息,包括集群中所有要素的計數以及渲染器映射的字段的平均值或主要值。
要基於圖層的渲染器為您的集群配置生成建議的預定義彈出模板,請參閱clusterPopupTemplateCreator。
PopupTemplate 可以包含一個或多個 Arcade 表達式,遵循 Arcade Feature Reduction Popup Profile 定義的規範。表達式必須返回字符串或數字,並且可以使用
$feature和$aggregatedFeatures全局變量訪問集群及其聚合特征的數據值。下表說明了集群渲染器內部使用的聚合字段,您可以在集群彈出窗口中引用這些字段。
聚合字段:
字段名稱 類型 說明 cluster_countnumber 集群中的特征數量。 cluster_avg_{fieldName}number 對於使用大小、不透明度、連續顏色或分類分隔來可視化數字字段的渲染器,該字段說明了集群中所有要素中渲染字段的平均值。 cluster_type_{fieldName}string 對於具有 UniqueValueRenderer 的圖層,此字段說明了集群內所有要素中渲染字段的模式或主要字符串。 以下
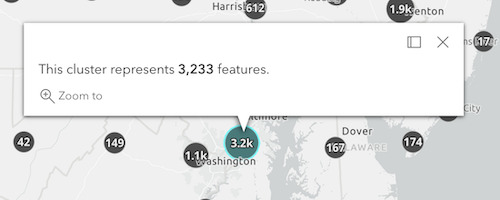
popupTemplate配置將顯示下圖中顯示的彈出窗口。簇數
layer.featureReduction = {
  type: "cluster",
  popupTemplate: {
    content: "This cluster represents {cluster_count} earthquakes."
  }
};
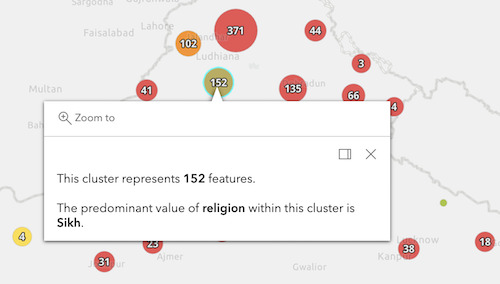
按主要類型劃分的集群
以下 featureReduction 配置假定圖層的渲染器是 UniqueValueRenderer,其字段名為
religion。layer.featureReduction = { type: "cluster", popupTemplate: { content: [{ type: "text", text: "This cluster represents <b>{cluster_count}</b> features." }, { type: "text", text: "The predominant place of worship in this cluster is <b>{cluster_type_religion}</b>." }] } };具有視覺變量的集群
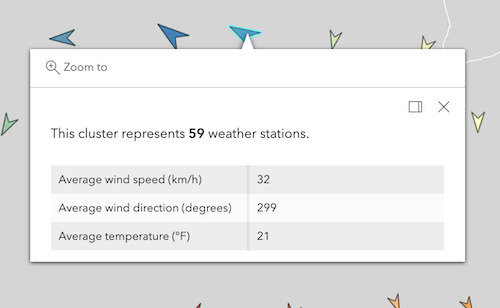
以下 featureReduction 配置假定圖層的渲染器包含引用名為
WIND_SPEED、WIND_DIRECT、TEMP的字段的視覺變量。layer.featureReduction = { type: "cluster", popupTemplate: { content: [{ type: "text", text: "This cluster represents <b>{cluster_count}</b> weather stations." }, { type: "fields", fieldInfos: [{ fieldName: "cluster_avg_WIND_SPEED", label: "Average wind speed (km/h)", format: { places: 0 } }, { fieldName: "cluster_avg_WIND_DIRECT", label: "Average wind direction (degrees)", format: { places: 0 } }, { fieldName: "cluster_avg_TEMP", label: "Average temperature (°F)", format: { places: 0 } }] }] } };例子:
// enables clustering on the layer with a
// popup describing the number of features represented by each cluster
layer.featureReduction = {
  type: "cluster",
  popupTemplate: {
    content: "This cluster represents <b>{cluster_count}</b> features."
    fieldInfos: [{
      fieldName: "cluster_count",
      format: {
        digitSeparator: true,
        places: 0
      }
    }]
  }
};
// enables clustering on the layer with a // popup describing the average value of // the field mapped by the renderer layer.featureReduction = { type: "cluster", renderer: { type: "simple", symbol: { type: "simple-marker", size: 8 }, label: "Weather stations", visualVariables: [ { type: "color", field: "Temperature", stops: [ { value: 32, color: "blue", label: "< 32° F" }, { value: 90, color: "red", label: ">90° F" } ] } ] }; popupTemplate: { content: [{ type: "text", text: "This cluster represents <b>{cluster_count}</b> features." }, { type: "text", text: "The average temperature in this cluster is <b>{cluster_avg_Temperature}° F</b>." }], fieldInfos: [{ fieldName: "cluster_count", format: { digitSeparator: true, places: 0 } }, { fieldName: "cluster_avg_Temperature", format: { places: 1 } }] } };// Displays an ordered list of the top 5 categories // of features contained within the cluster layer.popupTemplate = { title: "Power plant summary", content: [{ type: "expression", // lists the top 5 most common fuel types in the cluster expressionInfo: { expression: ` Expects($aggregatedFeatures, "fuel1") var statsFS = GroupBy($aggregatedFeatures, [ { name: 'Type', expression: 'fuel1'}, ], [ { name: 'num_features', expression: '1', statistic: 'COUNT' } ] ); var ordered = Top(OrderBy(statsFs, 'num_features DESC'), 5); // create an HTML ordered list as a string and return in a rich text element var list = "<ol>"; for (var group in ordered){ list += \`<li>\${group.Type} (\${Text(group.num_features, "#,###")})</li>\` } list += "</ol>"; return { type: "text", text: list } `, title: "List of fuel types" } }] };
基本信息
以下是所在類或對象的基本信息。
AMD:
require(["esri/layers/support/FeatureReductionCluster"], (FeatureReductionCluster) => { /* code goes here */ });
ESM:
import FeatureReductionCluster from "@arcgis/core/layers/support/FeatureReductionCluster";
類:
esri/layers/support/FeatureReductionCluster
繼承: FeatureReductionCluster > Accessor
自從:用於 JavaScript 4.14 的 ArcGIS API
用法說明
FeatureReductionCluster.popupTemplate函數(或屬性)的定義如下:
相關用法
- JavaScript ArcGIS FeatureReductionCluster.popupEnabled用法及代碼示例
- JavaScript ArcGIS FeatureReductionCluster.clusterMinSize用法及代碼示例
- JavaScript ArcGIS FeatureReductionCluster.clusterRadius用法及代碼示例
- JavaScript ArcGIS FeatureReductionCluster.type用法及代碼示例
- JavaScript ArcGIS FeatureReductionCluster.clusterMaxSize用法及代碼示例
- JavaScript ArcGIS FeatureReductionCluster.clone用法及代碼示例
- JavaScript ArcGIS FeatureReductionCluster.labelingInfo用法及代碼示例
- JavaScript ArcGIS FeatureReductionCluster.labelsVisible用法及代碼示例
- JavaScript ArcGIS FeatureReductionCluster用法及代碼示例
- JavaScript ArcGIS FeatureReductionSelection用法及代碼示例
- JavaScript ArcGIS FeatureReductionSelection.type用法及代碼示例
- JavaScript ArcGIS FeatureLayer.queryExtent用法及代碼示例
- JavaScript ArcGIS FeatureLayer.when用法及代碼示例
- JavaScript FeatureForm.when用法及代碼示例
- JavaScript ArcGIS FeatureLayer refresh事件用法及代碼示例
- JavaScript ArcGIS FeatureLayer.getFieldDomain用法及代碼示例
- JavaScript ArcGIS FeatureLayer.queryFeatureCount用法及代碼示例
- JavaScript FeatureForm.getValues用法及代碼示例
- JavaScript FeatureForm.visible用法及代碼示例
- JavaScript ArcGIS Feature.visible用法及代碼示例
- JavaScript ArcGIS FeatureLayer.formTemplate用法及代碼示例
- JavaScript ArcGIS Feature用法及代碼示例
- JavaScript FeatureForm.classes用法及代碼示例
- JavaScript ArcGIS FeatureLayer.relationships用法及代碼示例
- JavaScript ArcGIS FeatureLayer.objectIdField用法及代碼示例
注:本文由純淨天空篩選整理自arcgis.com大神的英文原創作品 FeatureReductionCluster.popupTemplate。非經特殊聲明,原始代碼版權歸原作者所有,本譯文未經允許或授權,請勿轉載或複製。


