K-Nearest Neighbours(KNN, K近邻)是一种分类算法,本文介绍了其背后的概念,以及如何在代码中实现它。

我们将使用Python中最常用的机器学习库scikit-learn来实现KNN。

Scikit-Learn是一个非常强大的机器学习库。它最初由David Cournapeau于2007年在Google Summer编程项目中开发。
该库也包含一些数据集。这里,我们将使用威斯康星州乳腺癌数据集(the Breast Cancer Wisconsin Dataset ),并研究如何实现KNN算法。
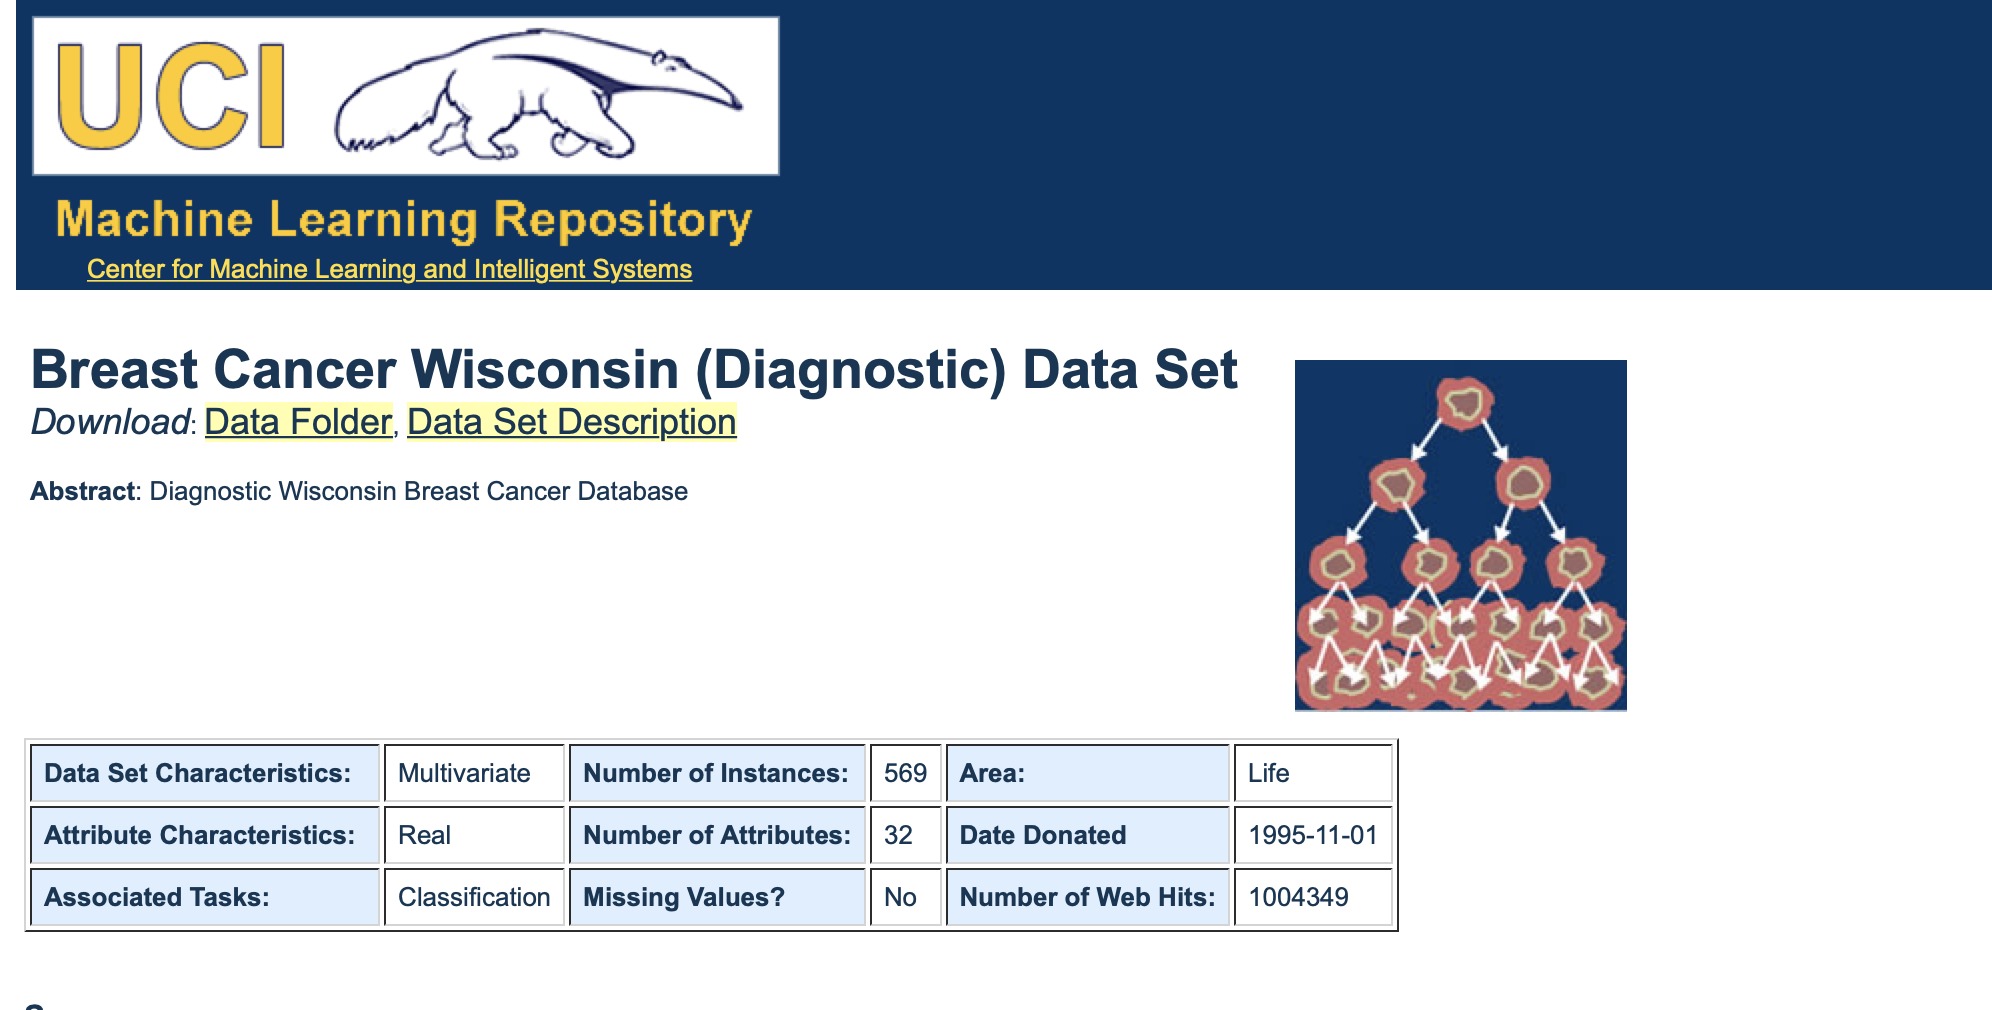
加载数据集
这是一个包含569个数据点的数据集。每个数据点都有30个特征值。这些特征共同决定一个人的细胞是恶性还是良性。
from sklearn.datasets import load_breast_cancer
data = load_breast_cancer()
了解数据集
# Print the information contained within the dataset
print(data.keys(),"\n")
#Print the feature names
count=0
for f in data.feature_names:
 count+=1
 print(count,"-",f)
#Print the classes
print(data.target_names,"\n")
#Printing the Initial Few Rows
print(data.data[0:3], "\n")
#Print the class values of first 30 datapoints
print(data.target[0:30], "\n")
#Print the dimensions of data
print(data.data.shape, "\n")数据中的信息(‘data’, ‘target’, ‘target_names’, ‘DESCR’, ‘feature_names’, ‘filename’)
- “data”-一个实际数据
- “target”-类值(标签值或者目标值)
- ‘target_names’—类名称(标签名或目标名):恶性/良性
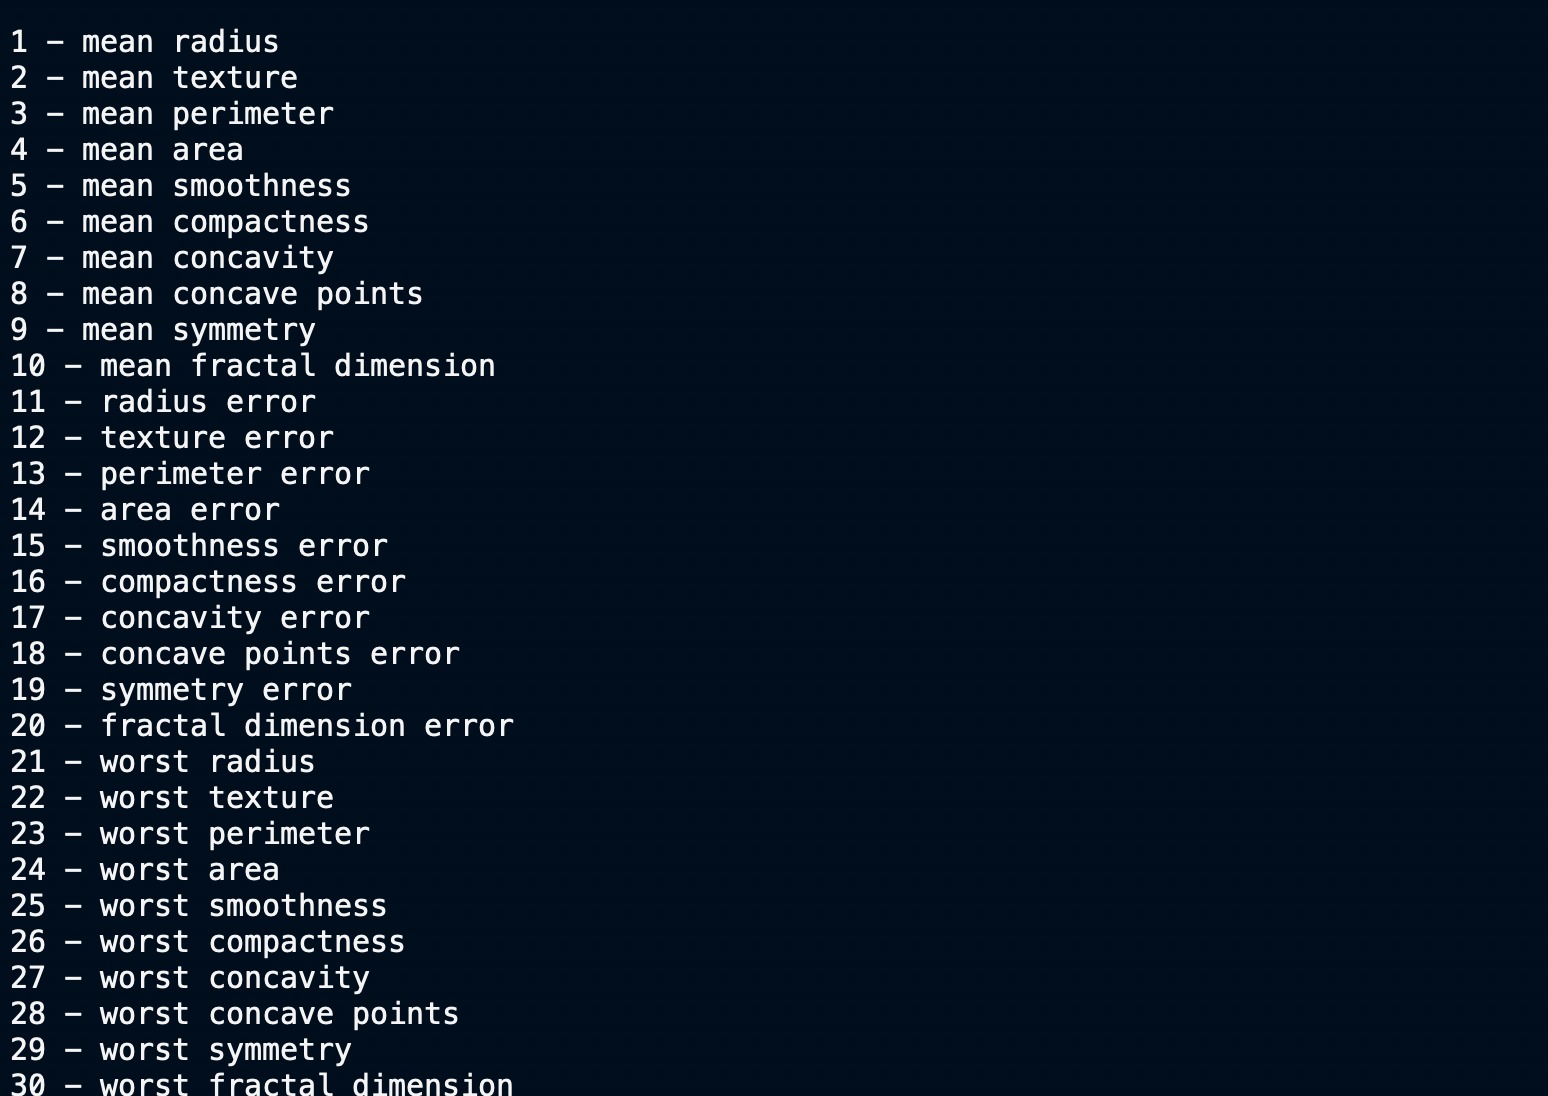
- ‘feature_names’—决定恶性的各种特征/属性的名称
特征名
目标值、名称和数据维度
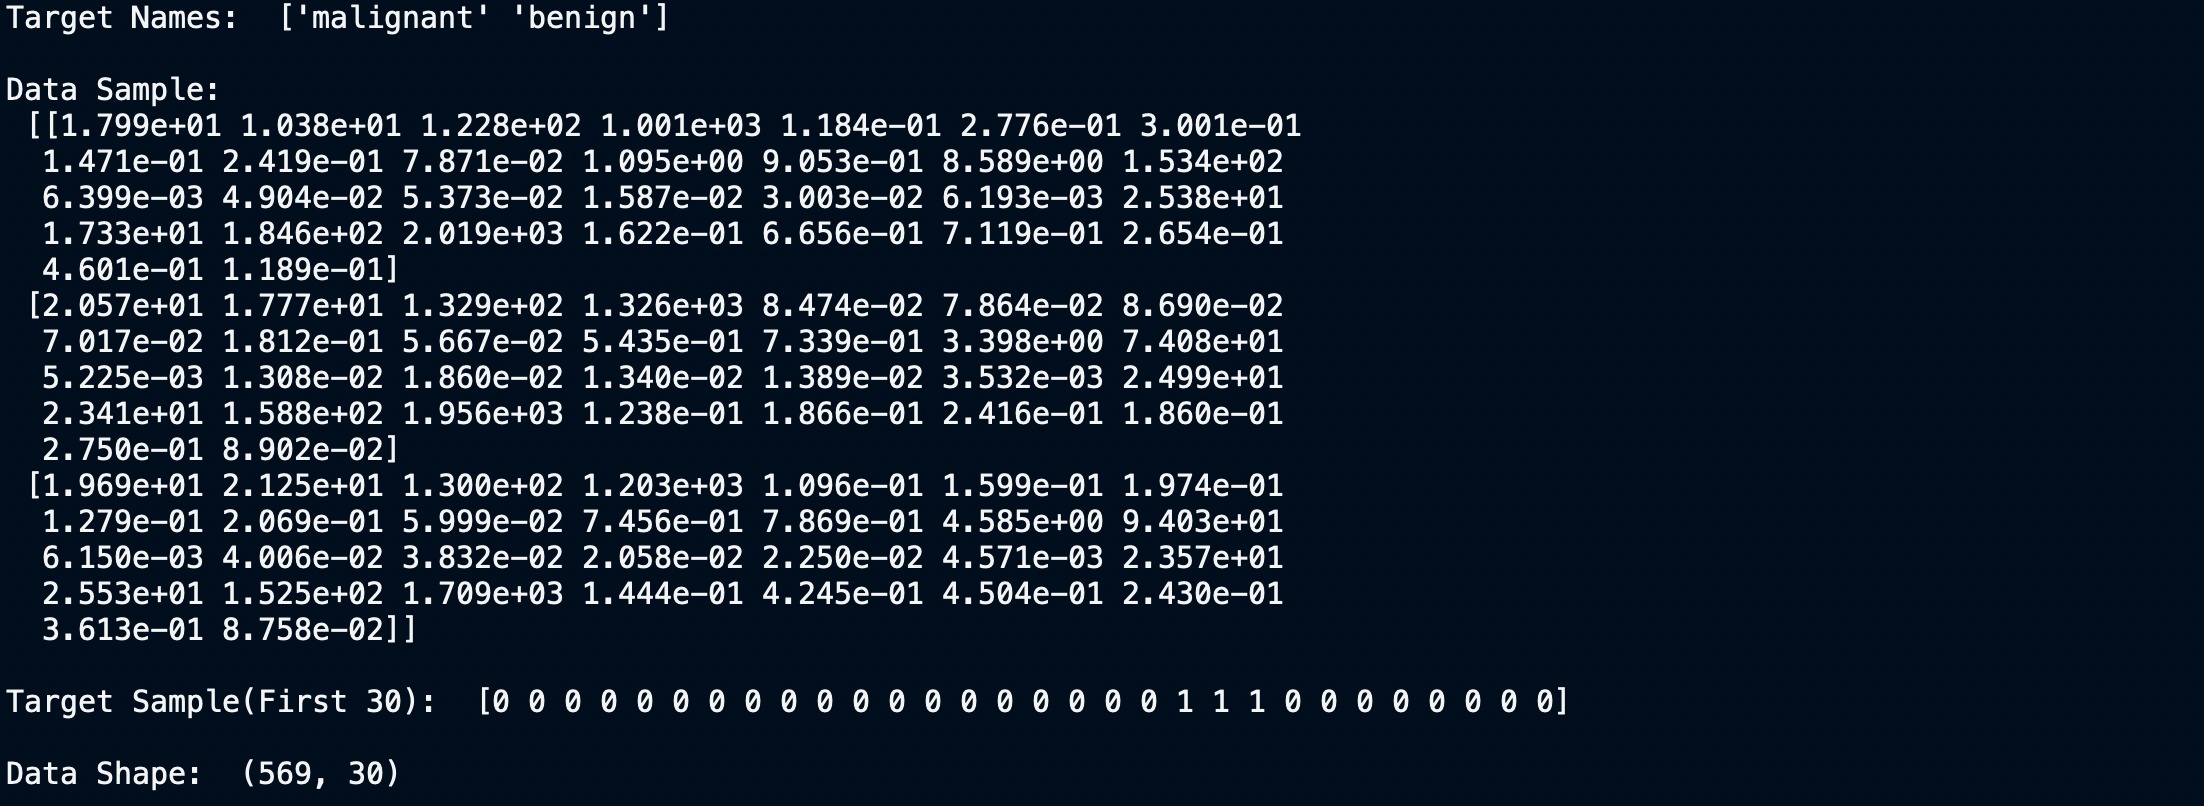

我们可以清楚地看到数据集有30列和569行。现在让我们为其建立模型。
绘制数据
切分数据
要了解模型性能,我们需要首先将数据集分切分训练集和测试集。
让我们使用函数 train_test_split()拆分数据集。您需要传递3个参数:特征、目标和测试集的大小。您也可以(可选)使用random_state随机选择记录。在我们的例子中,我们对训练集和测试集按90:10进行分割。
# Import train_test_split function
from sklearn.model_selection import train_test_split
# Split dataset into training set and test set
X_train, X_test, y_train, y_test = train_test_split(data.data, data.target, test_size=0.1) # 90% training and 10% test
过滤掉无用的功能
我们有30个定义数据的属性/特征,然而并非所有这些都是对我们的分类问题有用的。相关性(Correlation)很容易用来消除不重要的属性。
如果2个要素高度相关,则它们传达相同的信息。因此,可以删除其中之一。
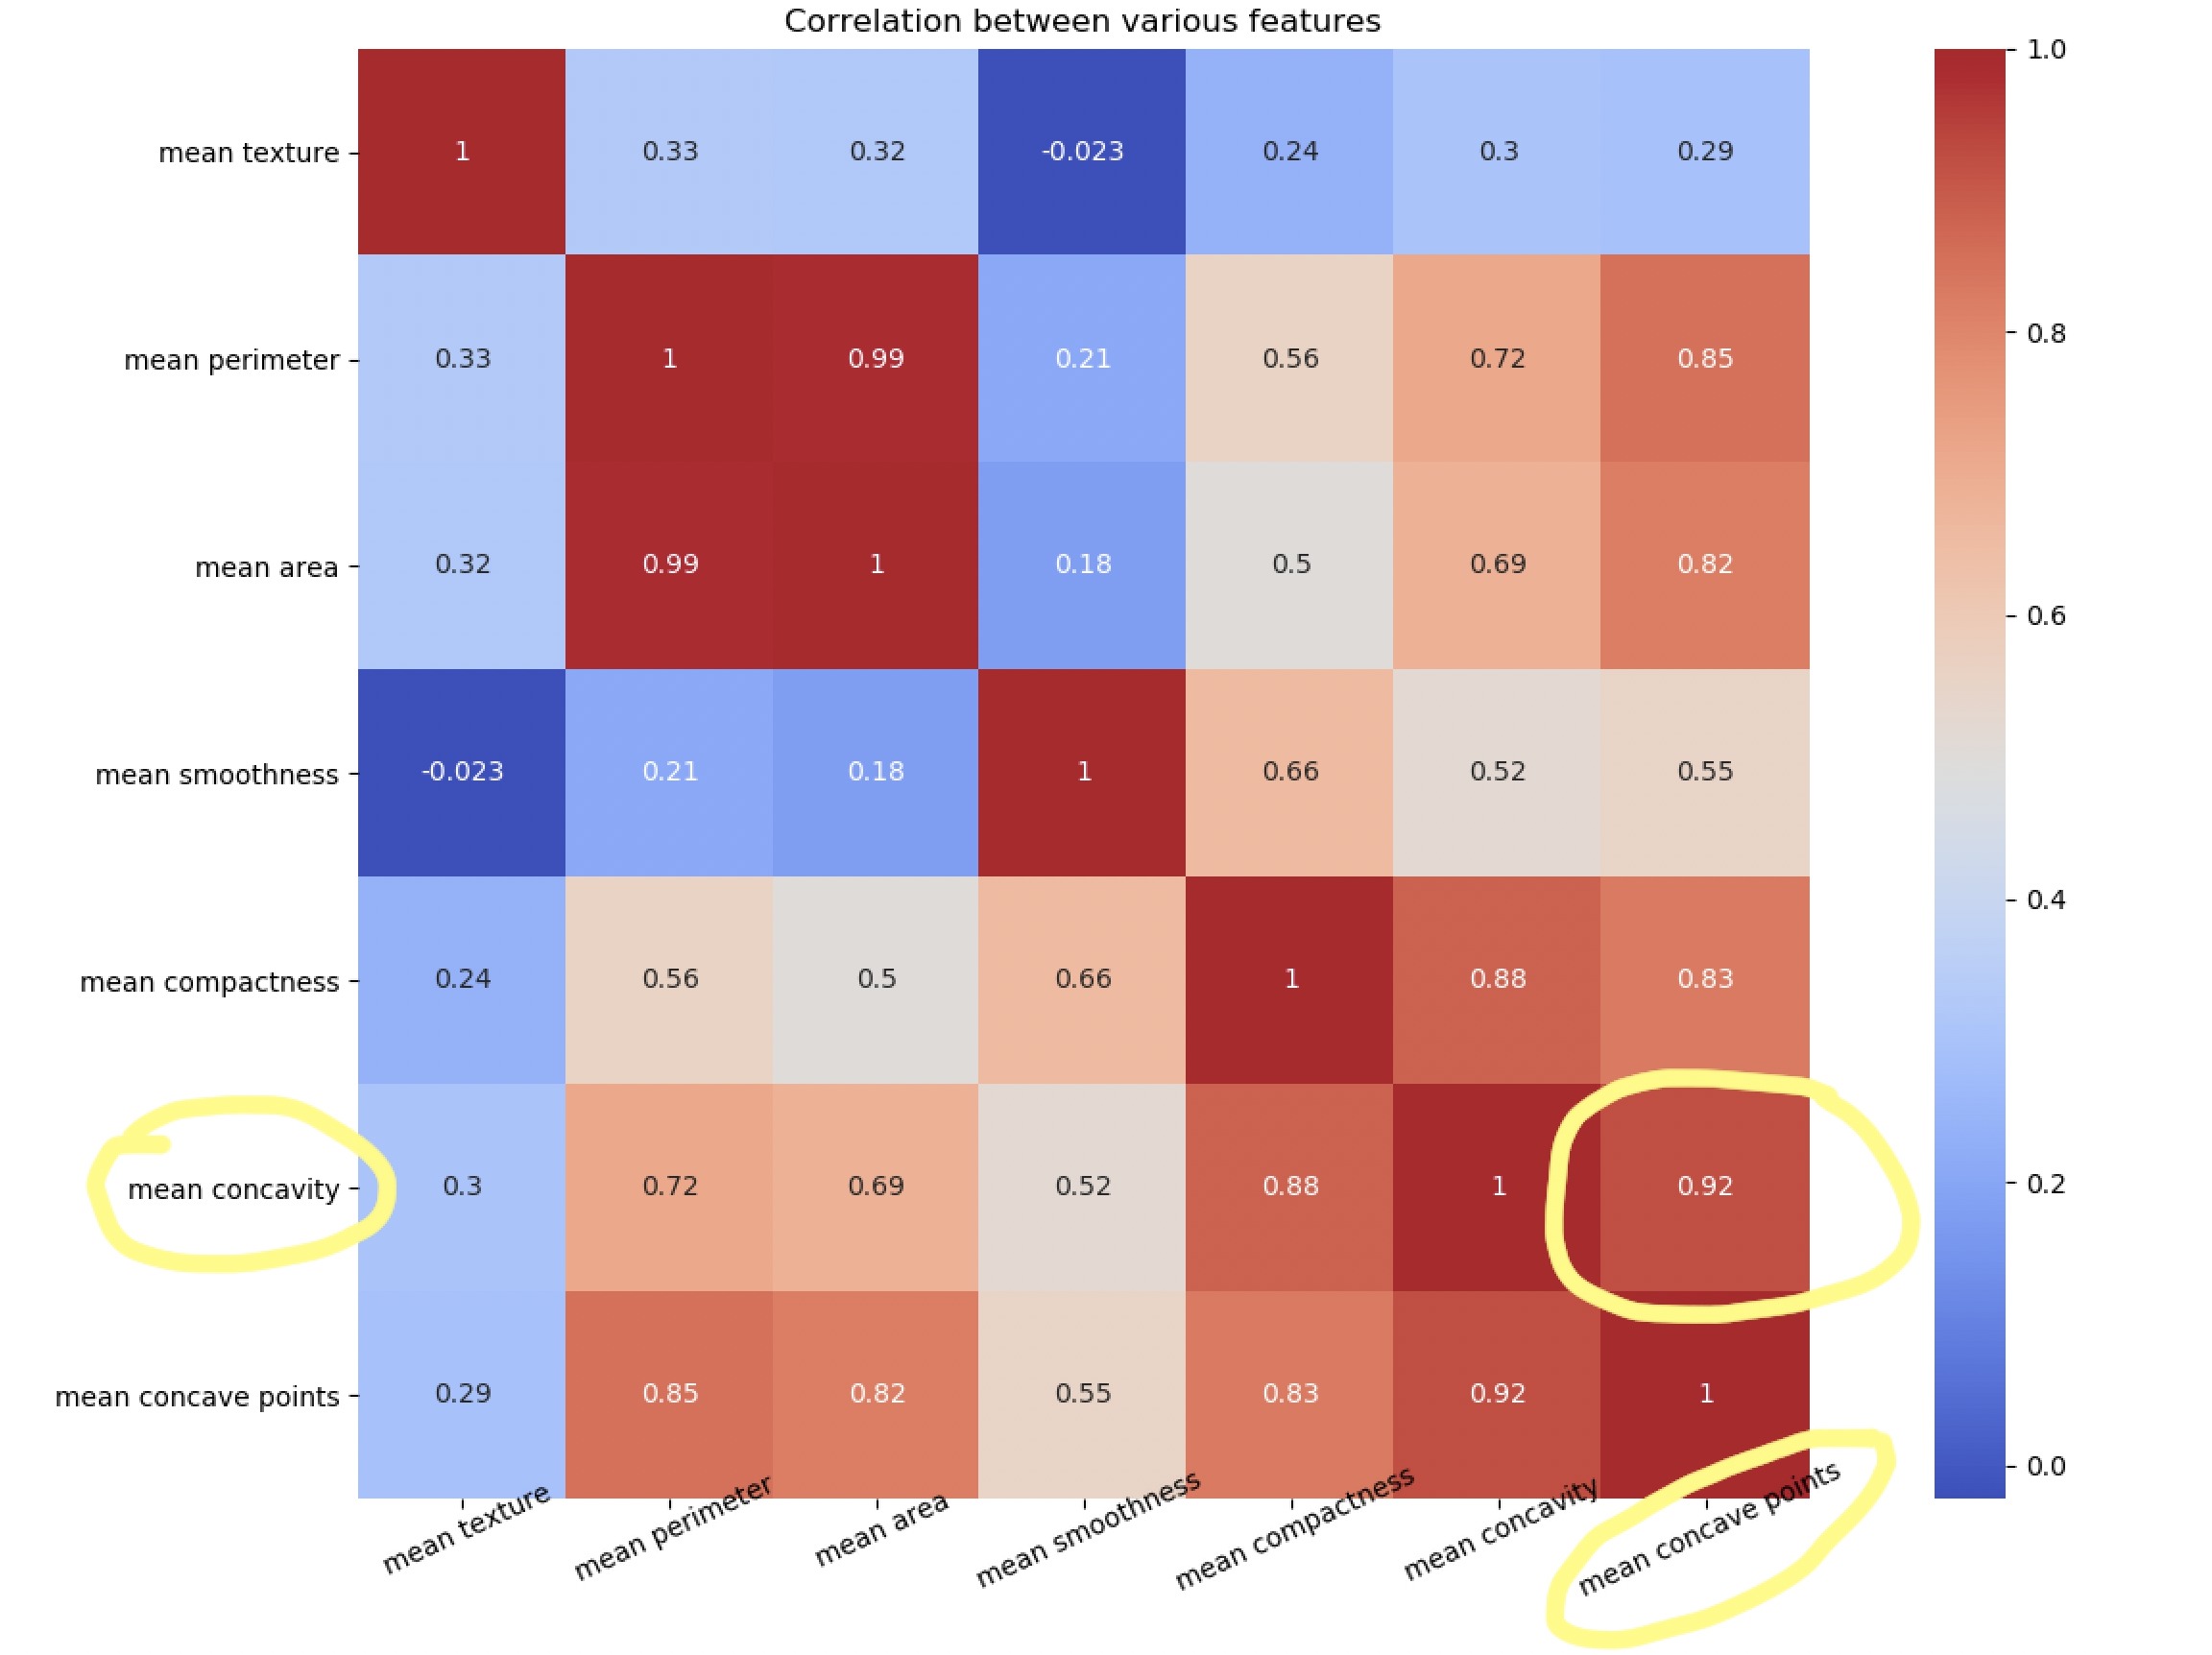
让我们绘制一个热图来了解相关性。右对角线始终为1,因为特征与其自身的相关性为1。
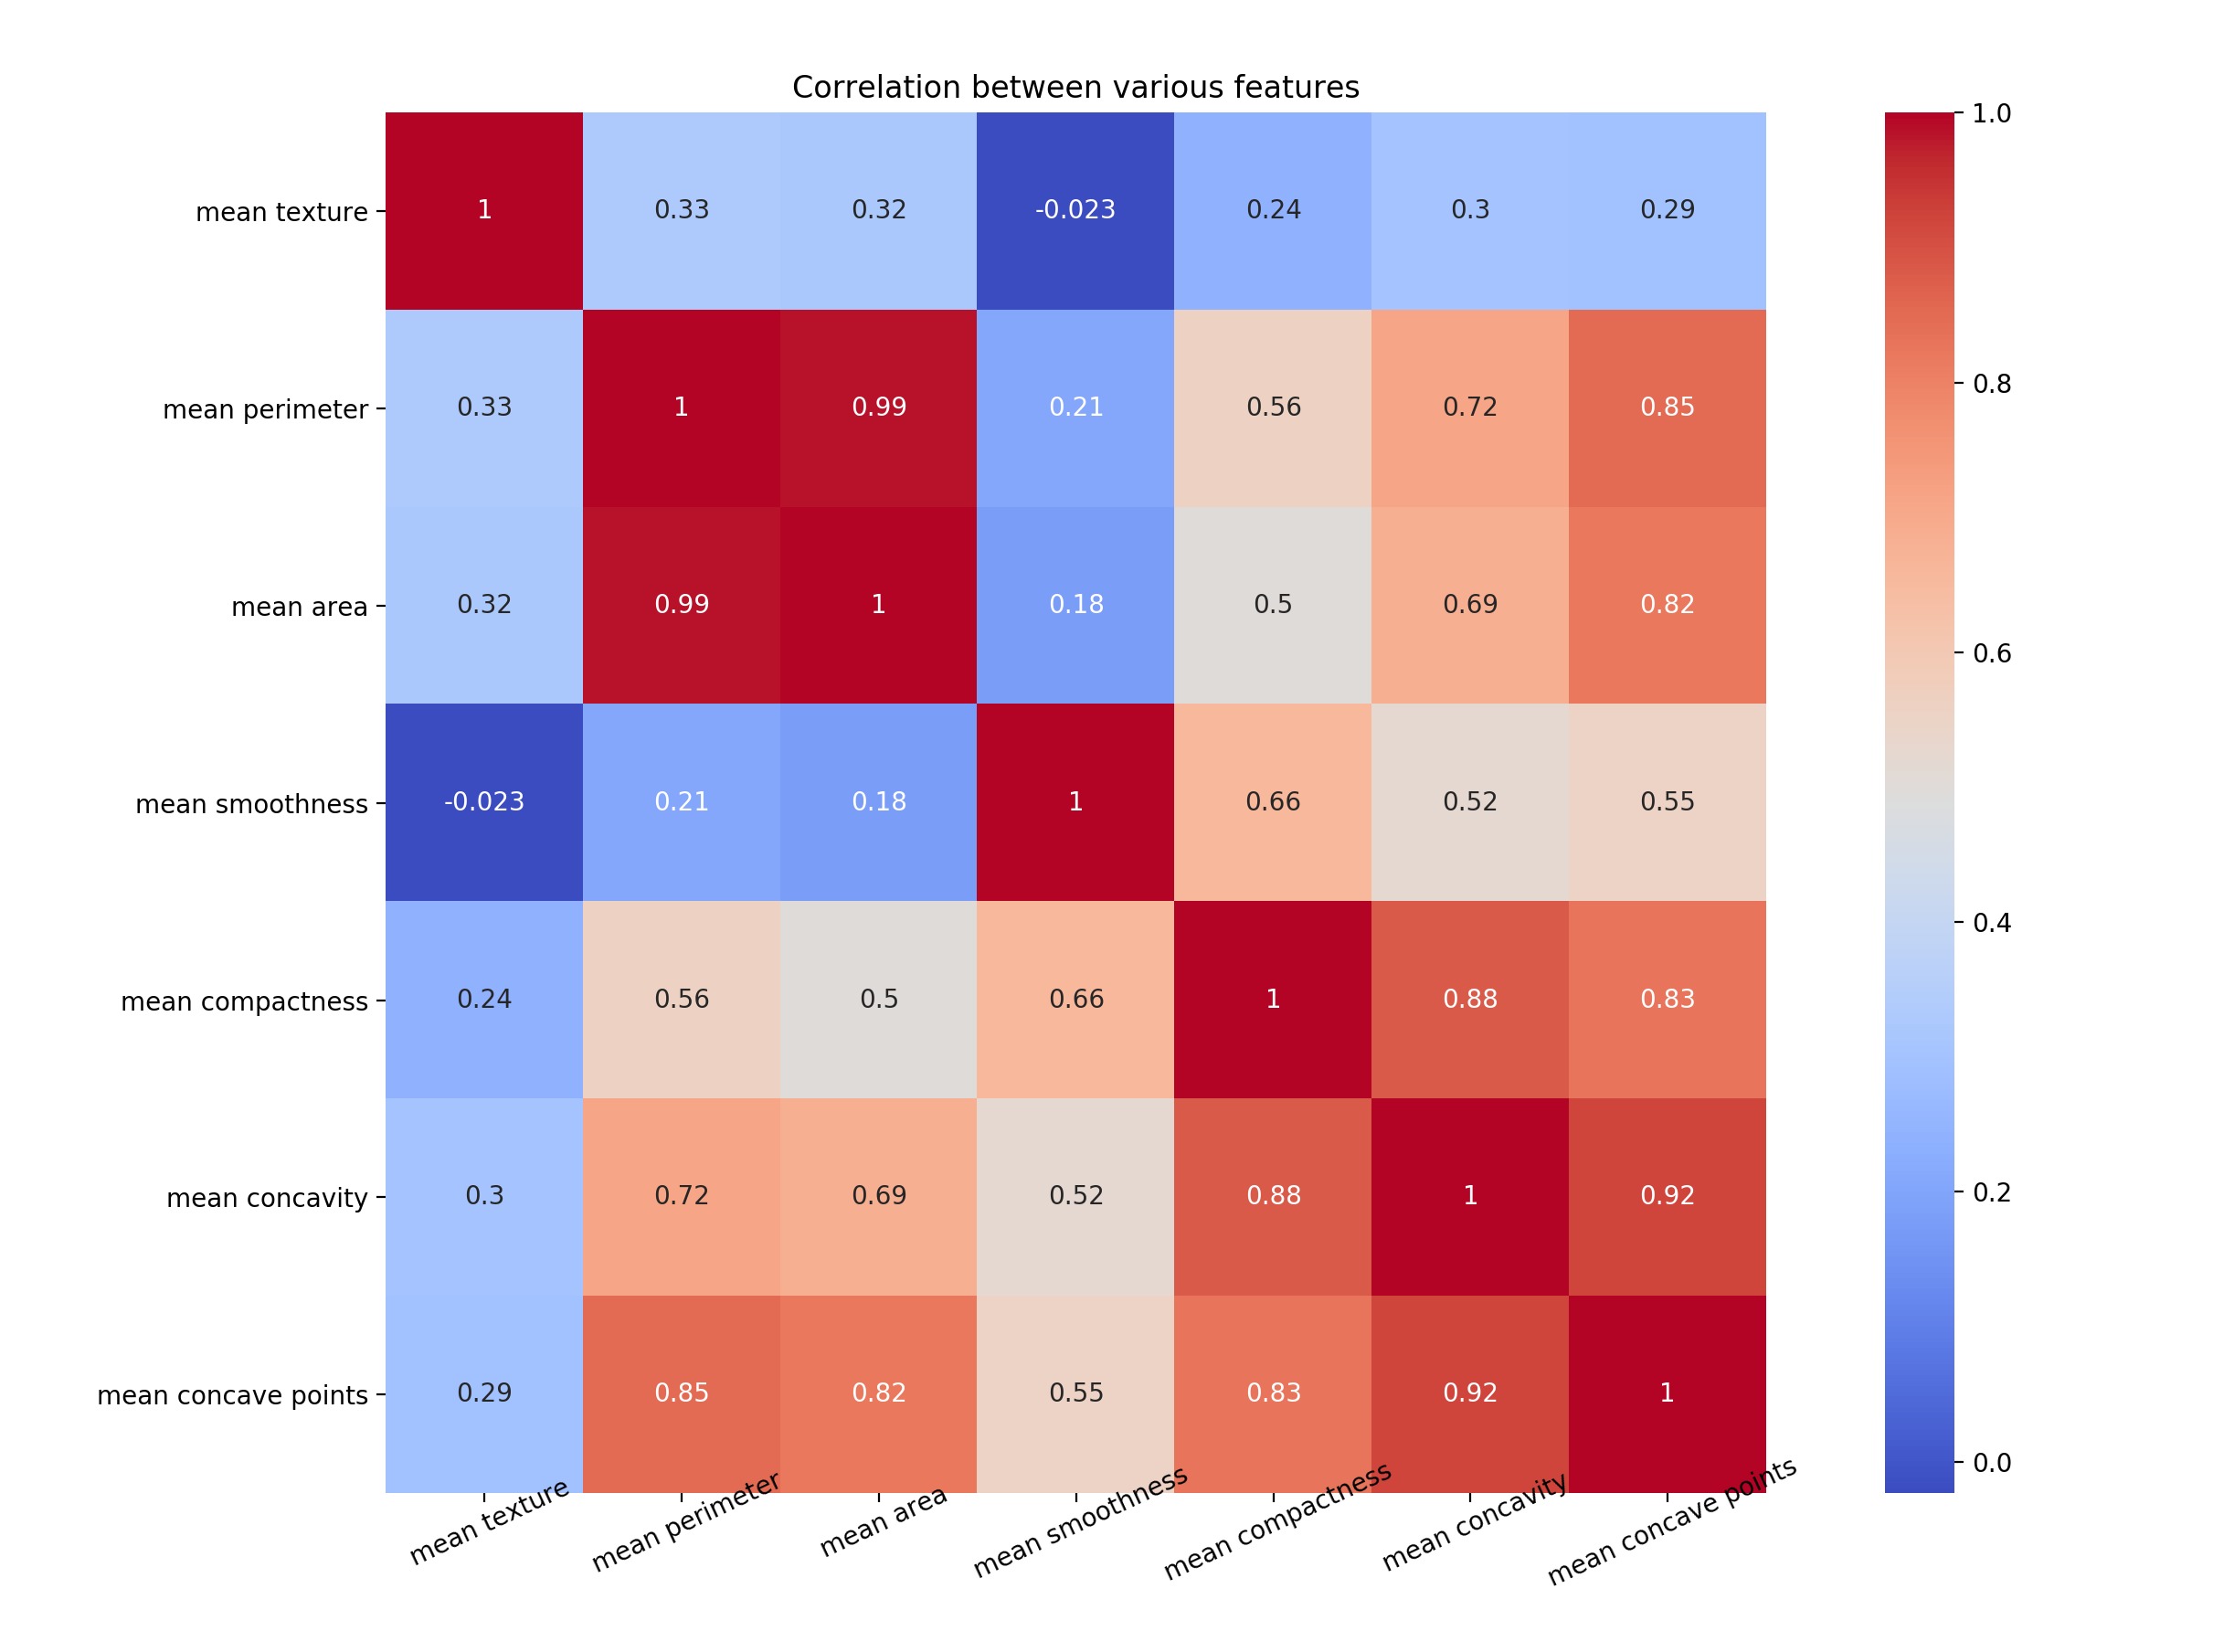
上图的代码如下
#Import the necessary libraries
import seaborn as sns
import pandas as pd
import matplotlib.pyplot as plt
import numpy as np
#Arrange the data as a dataframe
data1 = pd.DataFrame(data.data)
data1.columns = data.feature_names
# Plotting only 7 features out of 30
NUM_POINTS = 7
features_mean= list(data1.columns[1:NUM_POINTS+1])
feature_names = data.feature_names[1:NUM_POINTS+1]
print(feature_names)
f,ax = plt.subplots(1,1) #plt.figure(figsize=(10,10))
sns.heatmap(data1[features_mean].corr(), annot=True, square=True, cmap='coolwarm')
# Set number of ticks for x-axis
ax.set_xticks([float(n)+0.5 for n in range(NUM_POINTS)])
# Set ticks labels for x-axis
ax.set_xticklabels(feature_names, rotation=25, rotation_mode="anchor",fontsize=10)
# Set number of ticks for y-axis
ax.set_yticks([float(n)+0.5 for n in range(NUM_POINTS)])
# Set ticks labels for y-axis
ax.set_yticklabels(feature_names, rotation='horizontal', fontsize=10)
plt.title("Correlation between various features")
plt.show()
plt.close()注意mean concave points特征与mean concavity/strong>特征具有0.92的相关性。
散点矩阵
查看高度相关特征的另一种方法是绘制散点矩阵
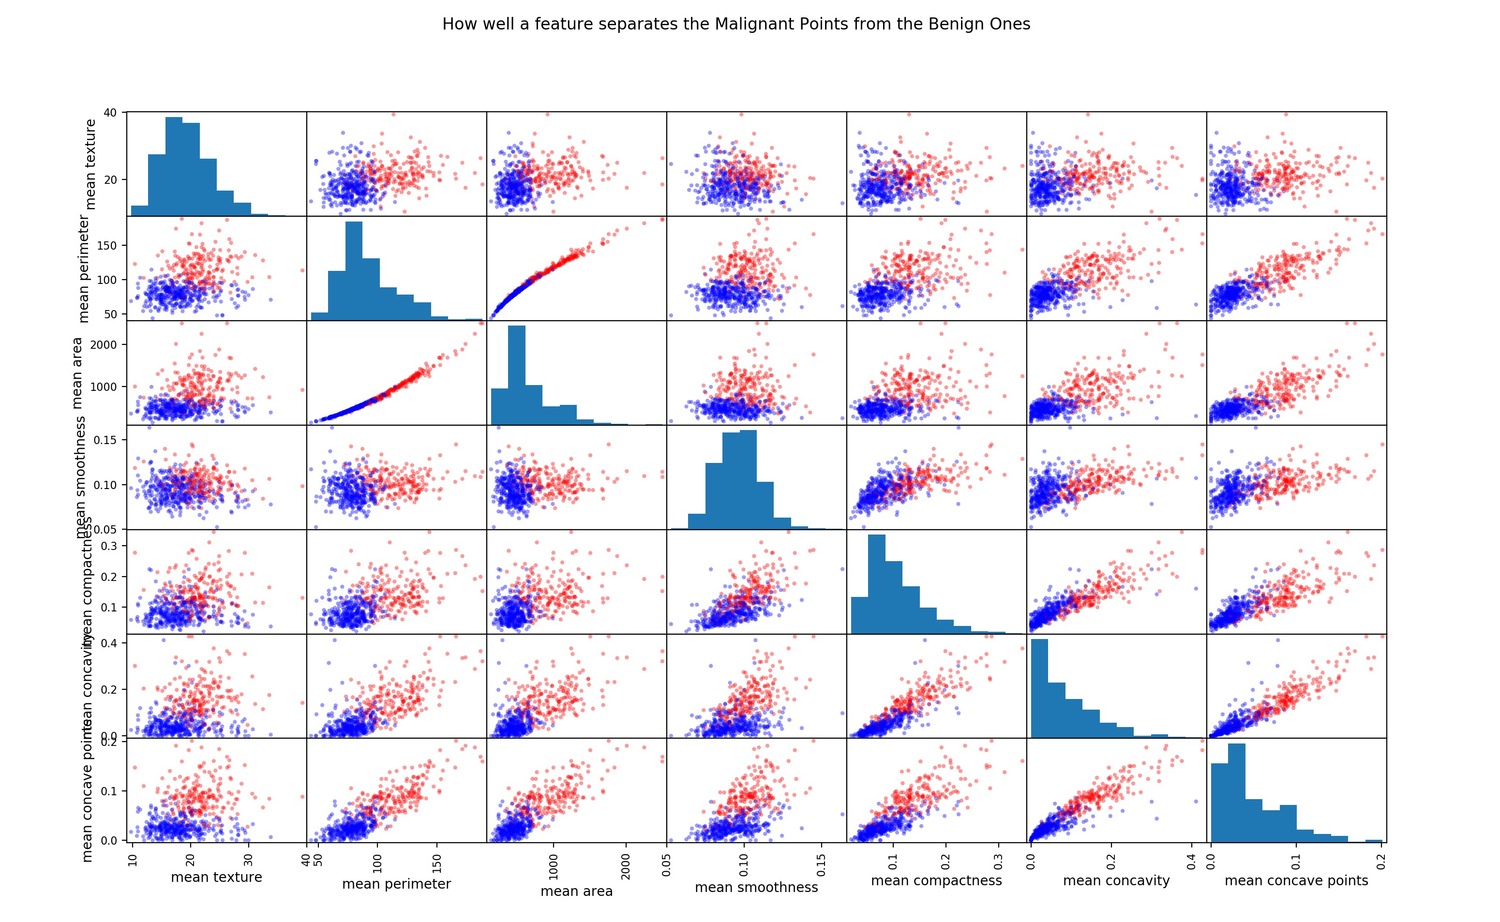
点分布得越多,特征关联就越少。
散点矩阵的代码如下
#Color Labels - 0 is benign and 1 is malignant
color_dic = {0:'red', 1:'blue'}
target_list = list(data['target'])
colors = list(map(lambda x: color_dic.get(x), target_list))
#Plotting the scatter matrix
sm = pd.plotting.scatter_matrix(data1[features_mean], c= colors, alpha=0.4, figsize=((10,10)))
plt.suptitle("How well a feature separates the Malignant Points from the Benign Ones")
plt.show()
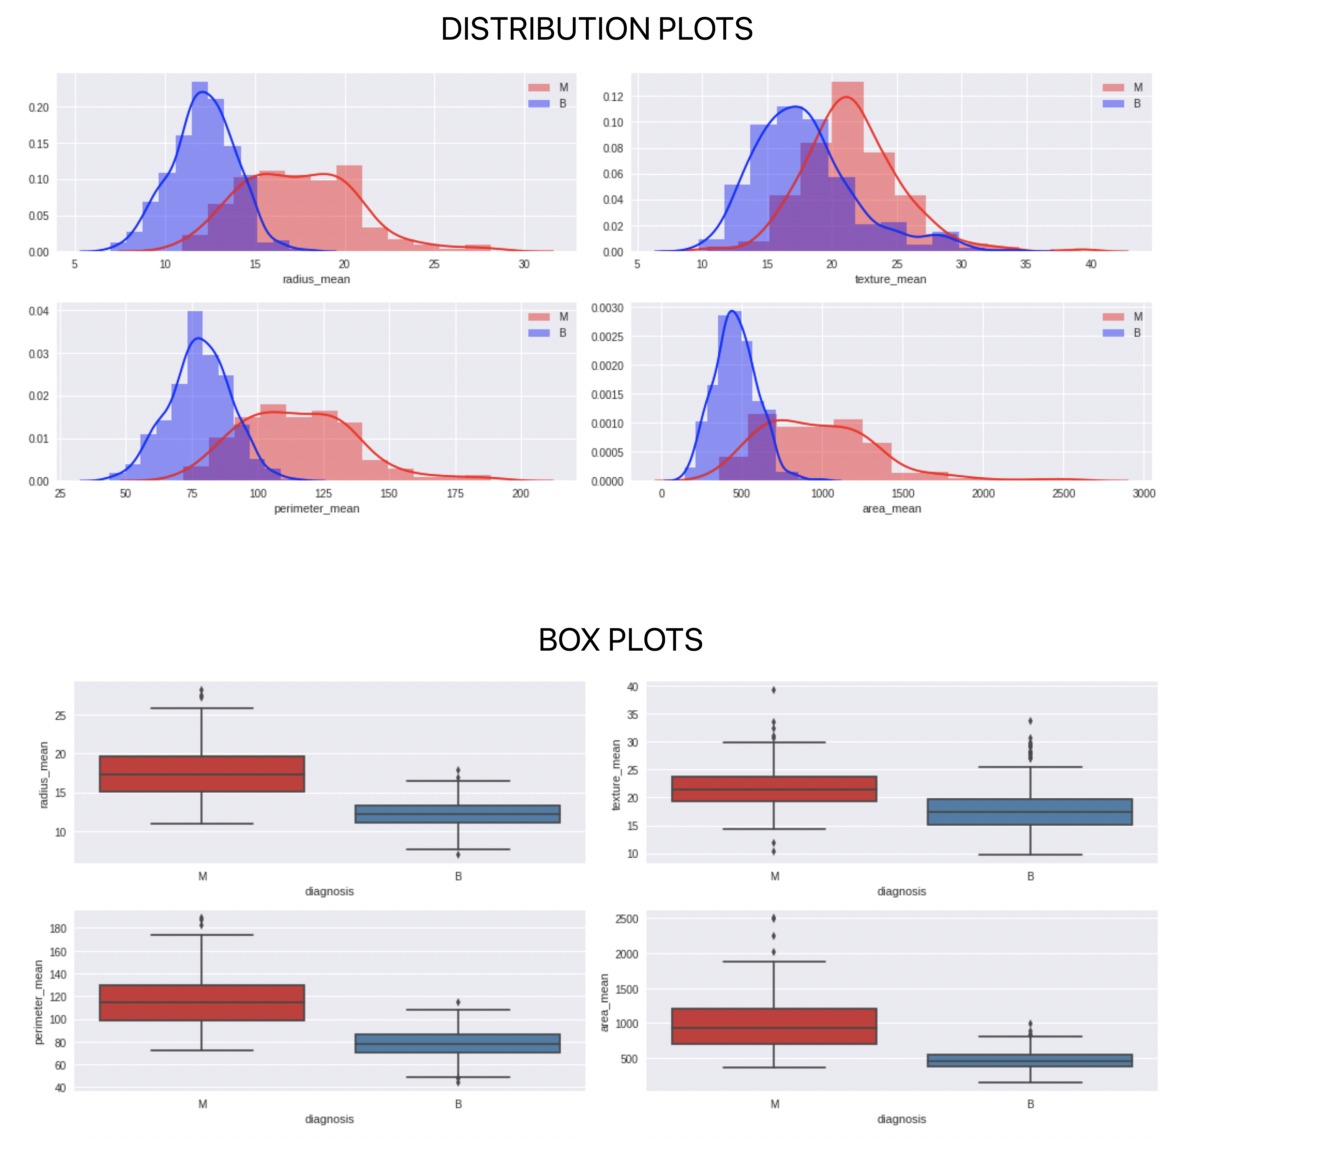
还可以进行其他类型的绘图,以进一步分析每个特征和2个类别。
建立模型和测试准确性
最后,我们进入构建模型并测试模型准确性的阶段。此处需要做的一件重要事情是确定K的值,我们分别使用K = 1、5和10并查看结果。

我们可以看到,K = 1的表现非常差,因为它没有吸收很多邻居的输入,而K = 5和10的表现几乎相似。
建立模型并获得准确性的代码如下
#Import knearest neighbors Classifier model
from sklearn.neighbors import KNeighborsClassifier
#Import scikit-learn metrics module for accuracy calculation
from sklearn import metrics
#Create KNN Classifiers
knn1 = KNeighborsClassifier(n_neighbors=1)
knn5 = KNeighborsClassifier(n_neighbors=5)
knn10 = KNeighborsClassifier(n_neighbors=10)
#Train the model using the training sets
knn1.fit(X_train, Y_train)
#Predict the response for test dataset
Y_pred = knn1.predict(X_test)
# Model Accuracy, how often is the classifier correct?
print("\n\nK=1, Accuracy:",round(metrics.accuracy_score(Y_test, Y_pred)*100,1), "%")
#Train the model using the training sets
knn5.fit(X_train, y=Y_train)
#Predict the response for test dataset
Y_pred = knn5.predict(X_test)
# Model Accuracy, how often is the classifier correct?
print("K=5 Accuracy:",round(metrics.accuracy_score(Y_test, Y_pred)*100,1), "%")
#Train the model using the training sets
knn10.fit(X_train, Y_train)
#Predict the response for test dataset
Y_pred = knn10.predict(X_test)
# Model Accuracy, how often is the classifier correct?
print("K=10 Accuracy:",round(metrics.accuracy_score(Y_test, Y_pred)*100,1), "%")