計算觀察類和預測類的 cross-tabulation。
用法
conf_mat(data, ...)

# S3 method for data.frame
conf_mat(
  data,
  truth,
  estimate,
  dnn = c("Prediction", "Truth"),
  case_weights = NULL,
  ...
)

# S3 method for conf_mat
tidy(x, ...)
參數
- data
-
數據幀或
base::table()。 - ...
-
不曾用過。
- truth
-
真實類結果的列標識符(即
factor)。這應該是一個不帶引號的列名,盡管此參數是通過表達式傳遞的並且支持quasiquotation(您可以不帶引號的列名)。對於_vec()函數,一個factor向量。 - estimate
-
預測類結果的列標識符(也是
factor)。與truth一樣,可以通過不同的方式指定,但主要方法是使用不帶引號的變量名稱。對於_vec()函數,一個factor向量。 - dnn
-
表的暗名稱的字符向量。
- case_weights
-
案例權重的可選列標識符。這應該是一個不帶引號的列名稱,其計算結果為
data中的數字列。對於_vec()函數,一個數值向量。 - x
-
conf_mat對象。
值
conf_mat() 生成一個具有類 conf_mat 的對象。它包含表和其他對象。 tidy.conf_mat() 生成一個包含列 name(單元格標識符)和 value(單元格計數)的 tibble。
當用於分組 DataFrame 時, conf_mat() 返回一個包含組列的 tibble 以及 conf_mat ,這是一個列表列,其中每個元素都是 conf_mat 對象。
細節
對於 conf_mat() 對象,創建了 broom tidy() 方法,該方法將單元格計數折疊到 DataFrame 中,以便於操作。
還有一個 summary() 方法可以同時計算各種分類指標。請參閱summary.conf_mat()
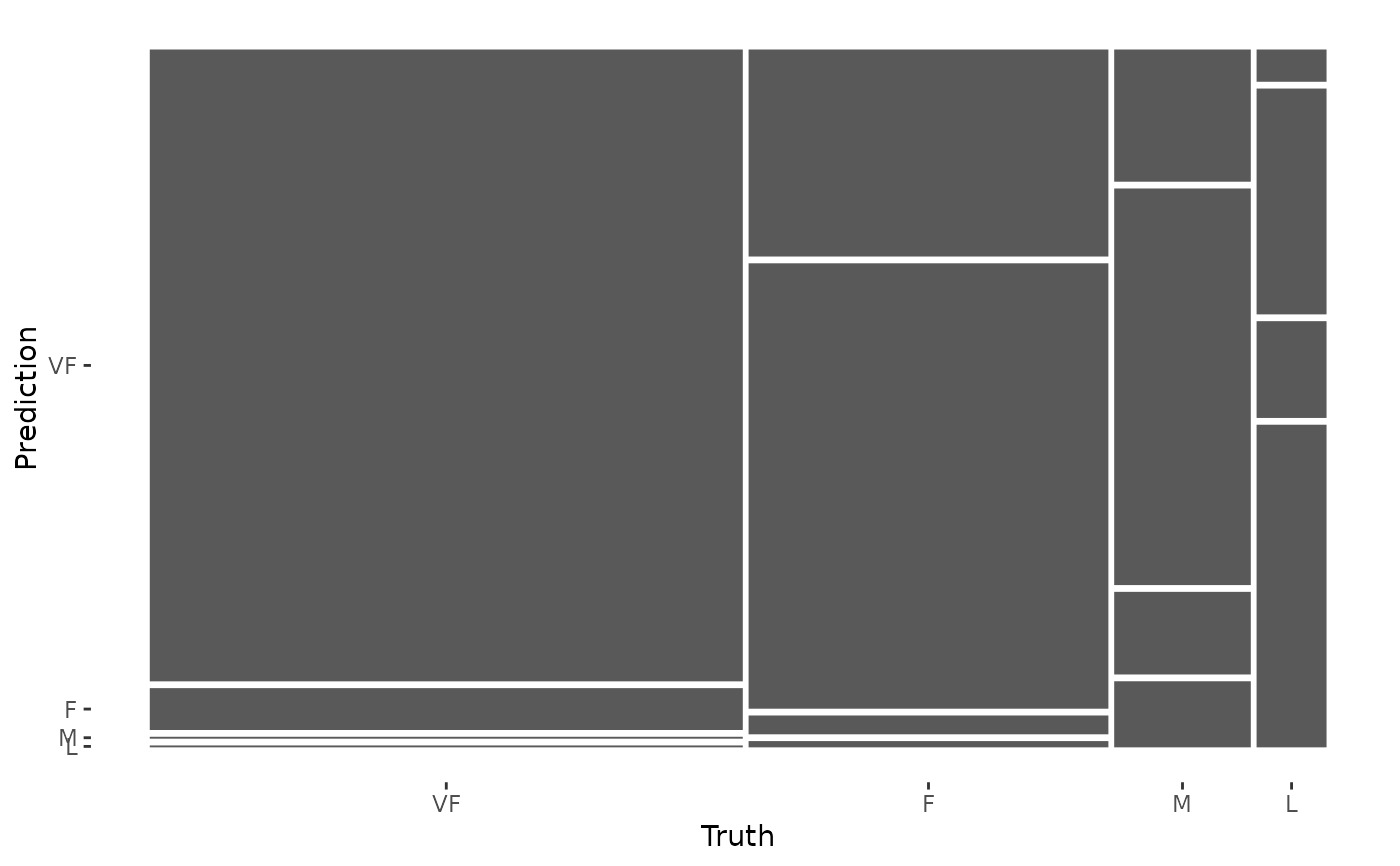
有一個ggplot2::autoplot() 方法可以快速可視化矩陣。熱圖和馬賽克類型均已實現。
該函數要求因子具有完全相同的水平。
也可以看看
summary.conf_mat() 用於從一個混淆矩陣計算大量指標。
例子
library(dplyr)
data("hpc_cv")

# The confusion matrix from a single assessment set (i.e. fold)
cm <- hpc_cv %>%
  filter(Resample == "Fold01") %>%
  conf_mat(obs, pred)
cm
#>           Truth
#> Prediction  VF   F   M   L
#>         VF 166  33   8   1
#>         F   11  71  24   7
#>         M    0   3   5   3
#>         L    0   1   4  10

# Now compute the average confusion matrix across all folds in
# terms of the proportion of the data contained in each cell.
# First get the raw cell counts per fold using the `tidy` method
library(tidyr)

cells_per_resample <- hpc_cv %>%
  group_by(Resample) %>%
  conf_mat(obs, pred) %>%
  mutate(tidied = lapply(conf_mat, tidy)) %>%
  unnest(tidied)

# Get the totals per resample
counts_per_resample <- hpc_cv %>%
  group_by(Resample) %>%
  summarize(total = n()) %>%
  left_join(cells_per_resample, by = "Resample") %>%
  # Compute the proportions
  mutate(prop = value / total) %>%
  group_by(name) %>%
  # Average
  summarize(prop = mean(prop))

counts_per_resample
#> # A tibble: 16 × 2
#>    name         prop
#>    <chr>       <dbl>
#>  1 cell_1_1 0.467
#>  2 cell_1_2 0.107
#>  3 cell_1_3 0.0185
#>  4 cell_1_4 0.00259
#>  5 cell_2_1 0.0407
#>  6 cell_2_2 0.187
#>  7 cell_2_3 0.0632
#>  8 cell_2_4 0.0173
#>  9 cell_3_1 0.00173
#> 10 cell_3_2 0.00692
#> 11 cell_3_3 0.0228
#> 12 cell_3_4 0.00807
#> 13 cell_4_1 0.000575
#> 14 cell_4_2 0.0104
#> 15 cell_4_3 0.0144
#> 16 cell_4_4 0.0320

# Now reshape these into a matrix
mean_cmat <- matrix(counts_per_resample$prop, byrow = TRUE, ncol = 4)
rownames(mean_cmat) <- levels(hpc_cv$obs)
colnames(mean_cmat) <- levels(hpc_cv$obs)

round(mean_cmat, 3)
#>       VF     F     M     L
#> VF 0.467 0.107 0.018 0.003
#> F  0.041 0.187 0.063 0.017
#> M  0.002 0.007 0.023 0.008
#> L  0.001 0.010 0.014 0.032

# The confusion matrix can quickly be visualized using autoplot()
library(ggplot2)

autoplot(cm, type = "mosaic")

autoplot(cm, type = "heatmap")

相關用法
- R yardstick ccc 一致性相關係數
- R yardstick classification_cost 不良分類的成本函數
- R yardstick pr_auc 查準率曲線下麵積
- R yardstick accuracy 準確性
- R yardstick gain_capture 增益捕獲
- R yardstick pr_curve 精確率召回曲線
- R yardstick mn_log_loss 多項數據的平均對數損失
- R yardstick rpd 性能與偏差之比
- R yardstick mae 平均絕對誤差
- R yardstick detection_prevalence 檢測率
- R yardstick bal_accuracy 平衡的精度
- R yardstick rpiq 績效與四分位間的比率
- R yardstick roc_aunp 使用先驗類別分布,每個類別相對於其他類別的 ROC 曲線下麵積
- R yardstick roc_curve 接收者算子曲線
- R yardstick rsq R 平方
- R yardstick msd 平均符號偏差
- R yardstick mpe 平均百分比誤差
- R yardstick iic 相關性理想指數
- R yardstick recall 記起
- R yardstick roc_aunu 使用均勻類別分布,每個類別相對於其他類別的 ROC 曲線下麵積
- R yardstick npv 陰性預測值
- R yardstick rmse 均方根誤差
- R yardstick sens 靈敏度
- R yardstick rsq_trad R 平方 - 傳統
- R yardstick poisson_log_loss 泊鬆數據的平均對數損失
注:本文由純淨天空篩選整理自Max Kuhn等大神的英文原創作品 Confusion Matrix for Categorical Data。非經特殊聲明,原始代碼版權歸原作者所有,本譯文未經允許或授權,請勿轉載或複製。
