gain_capture() 是類似於 AUC 計算的性能度量,但應用於增益曲線。
用法
gain_capture(data, ...)

# S3 method for data.frame
gain_capture(
  data,
  truth,
  ...,
  estimator = NULL,
  na_rm = TRUE,
  event_level = yardstick_event_level(),
  case_weights = NULL
)

gain_capture_vec(
  truth,
  estimate,
  estimator = NULL,
  na_rm = TRUE,
  event_level = yardstick_event_level(),
  case_weights = NULL,
  ...
)
參數
- data
-
包含
truth和...指定的列的data.frame。 - ...
-
一組不帶引號的列名稱或一個或多個
dplyr選擇器函數,用於選擇哪些變量包含類概率。如果truth是二進製,則僅應選擇 1 列,並且它應對應於event_level的值。否則,列的數量應與truth的因子級別一樣多,並且列的順序應與truth的因子級別相同。 - truth
-
真實類結果的列標識符(即
factor)。這應該是一個不帶引號的列名,盡管此參數是通過表達式傳遞的並且支持quasiquotation(您可以不帶引號的列名)。對於_vec()函數,一個factor向量。 - estimator
-
"binary"、"macro"或"macro_weighted"之一指定要完成的平均類型。"binary"僅與兩類情況相關。另外兩個是計算多類指標的通用方法。默認會根據truth自動選擇"binary"或"macro"。 - na_rm
-
logical值,指示在計算繼續之前是否應剝離NA值。 - event_level
-
單個字符串。
"first"或"second"指定將truth的哪個級別視為"event"。此參數僅適用於estimator = "binary"。默認使用內部幫助程序,通常默認為"first",但是,如果設置了已棄用的全局選項yardstick.event_first,則將使用該幫助程序並發出警告。 - case_weights
-
案例權重的可選列標識符。這應該是一個不帶引號的列名稱,其計算結果為
data中的數字列。對於_vec()函數,一個數值向量。 - estimate
-
如果
truth是二進製的,對應於 "relevant" 類的類概率的數值向量。否則,矩陣的列數與因子級別一樣多truth.假設它們的順序與truth的級別相同。
值
tibble 包含列 .metric 、 .estimator 和 .estimate 以及 1 行值。
對於分組 DataFrame ,返回的行數將與組數相同。
對於 gain_capture_vec() ,單個 numeric 值(或 NA )。
細節
gain_capture() 計算增益曲線下方但基線上方的麵積,然後除以完美增益曲線下方但基線上方的麵積。它旨在表示模型的潛在增益"captured"。
gain_capture() 指標與準確率 (AR) 相同,有時也稱為基尼係數。這兩者通常是在累積精度剖麵曲線上計算的,但這與增益曲線相同。有關詳細信息,請參閱 Engelmann 引用。
相關級別
在計算二元分類指標時,對於哪個因子級別應自動被視為 "event" 或 "positive" 結果,沒有通用約定。在 yardstick 中,默認使用第一級。要更改此設置,請將參數 event_level 更改為 "second" 以將因子的最後一個級別視為感興趣級別。對於涉及 one-vs-all 比較(例如宏平均)的多類擴展,此選項將被忽略,並且 "one" 級別始終是相關結果。
多級
此指標可使用宏觀平均和宏觀加權平均。如果提供了超過 2 個級別的 truth 因子,則默認選擇宏平均。否則,將進行標準二進製計算。有關詳細信息,請參閱vignette("multiclass", "yardstick")。
也可以看看
gain_curve() 計算完整增益曲線。
其他類概率指標:average_precision() , brier_class() , classification_cost() , mn_log_loss() , pr_auc() , roc_auc() , roc_aunp() , roc_aunu()
例子
# ---------------------------------------------------------------------------
# Two class example
# `truth` is a 2 level factor. The first level is `"Class1"`, which is the
# "event of interest" by default in yardstick. See the Relevant Level
# section above.
data(two_class_example)
# Binary metrics using class probabilities take a factor `truth` column,
# and a single class probability column containing the probabilities of
# the event of interest. Here, since `"Class1"` is the first level of
# `"truth"`, it is the event of interest and we pass in probabilities for it.
gain_capture(two_class_example, truth, Class1)
#> # A tibble: 1 × 3
#> .metric .estimator .estimate
#> <chr> <chr> <dbl>
#> 1 gain_capture binary 0.879
# ---------------------------------------------------------------------------
# Multiclass example
# `obs` is a 4 level factor. The first level is `"VF"`, which is the
# "event of interest" by default in yardstick. See the Relevant Level
# section above.
data(hpc_cv)
# You can use the col1:colN tidyselect syntax
library(dplyr)
hpc_cv %>%
filter(Resample == "Fold01") %>%
gain_capture(obs, VF:L)
#> # A tibble: 1 × 3
#> .metric .estimator .estimate
#> <chr> <chr> <dbl>
#> 1 gain_capture macro 0.743
# Change the first level of `obs` from `"VF"` to `"M"` to alter the
# event of interest. The class probability columns should be supplied
# in the same order as the levels.
hpc_cv %>%
filter(Resample == "Fold01") %>%
mutate(obs = relevel(obs, "M")) %>%
gain_capture(obs, M, VF:L)
#> # A tibble: 1 × 3
#> .metric .estimator .estimate
#> <chr> <chr> <dbl>
#> 1 gain_capture macro 0.743
# Groups are respected
hpc_cv %>%
group_by(Resample) %>%
gain_capture(obs, VF:L)
#> # A tibble: 10 × 4
#> Resample .metric .estimator .estimate
#> <chr> <chr> <chr> <dbl>
#> 1 Fold01 gain_capture macro 0.743
#> 2 Fold02 gain_capture macro 0.727
#> 3 Fold03 gain_capture macro 0.796
#> 4 Fold04 gain_capture macro 0.748
#> 5 Fold05 gain_capture macro 0.730
#> 6 Fold06 gain_capture macro 0.754
#> 7 Fold07 gain_capture macro 0.730
#> 8 Fold08 gain_capture macro 0.747
#> 9 Fold09 gain_capture macro 0.710
#> 10 Fold10 gain_capture macro 0.731
# Weighted macro averaging
hpc_cv %>%
group_by(Resample) %>%
gain_capture(obs, VF:L, estimator = "macro_weighted")
#> # A tibble: 10 × 4
#> Resample .metric .estimator .estimate
#> <chr> <chr> <chr> <dbl>
#> 1 Fold01 gain_capture macro_weighted 0.759
#> 2 Fold02 gain_capture macro_weighted 0.745
#> 3 Fold03 gain_capture macro_weighted 0.811
#> 4 Fold04 gain_capture macro_weighted 0.734
#> 5 Fold05 gain_capture macro_weighted 0.733
#> 6 Fold06 gain_capture macro_weighted 0.730
#> 7 Fold07 gain_capture macro_weighted 0.737
#> 8 Fold08 gain_capture macro_weighted 0.730
#> 9 Fold09 gain_capture macro_weighted 0.681
#> 10 Fold10 gain_capture macro_weighted 0.737
# Vector version
# Supply a matrix of class probabilities
fold1 <- hpc_cv %>%
filter(Resample == "Fold01")
gain_capture_vec(
truth = fold1$obs,
matrix(
c(fold1$VF, fold1$F, fold1$M, fold1$L),
ncol = 4
)
)
#> [1] 0.7428922
# ---------------------------------------------------------------------------
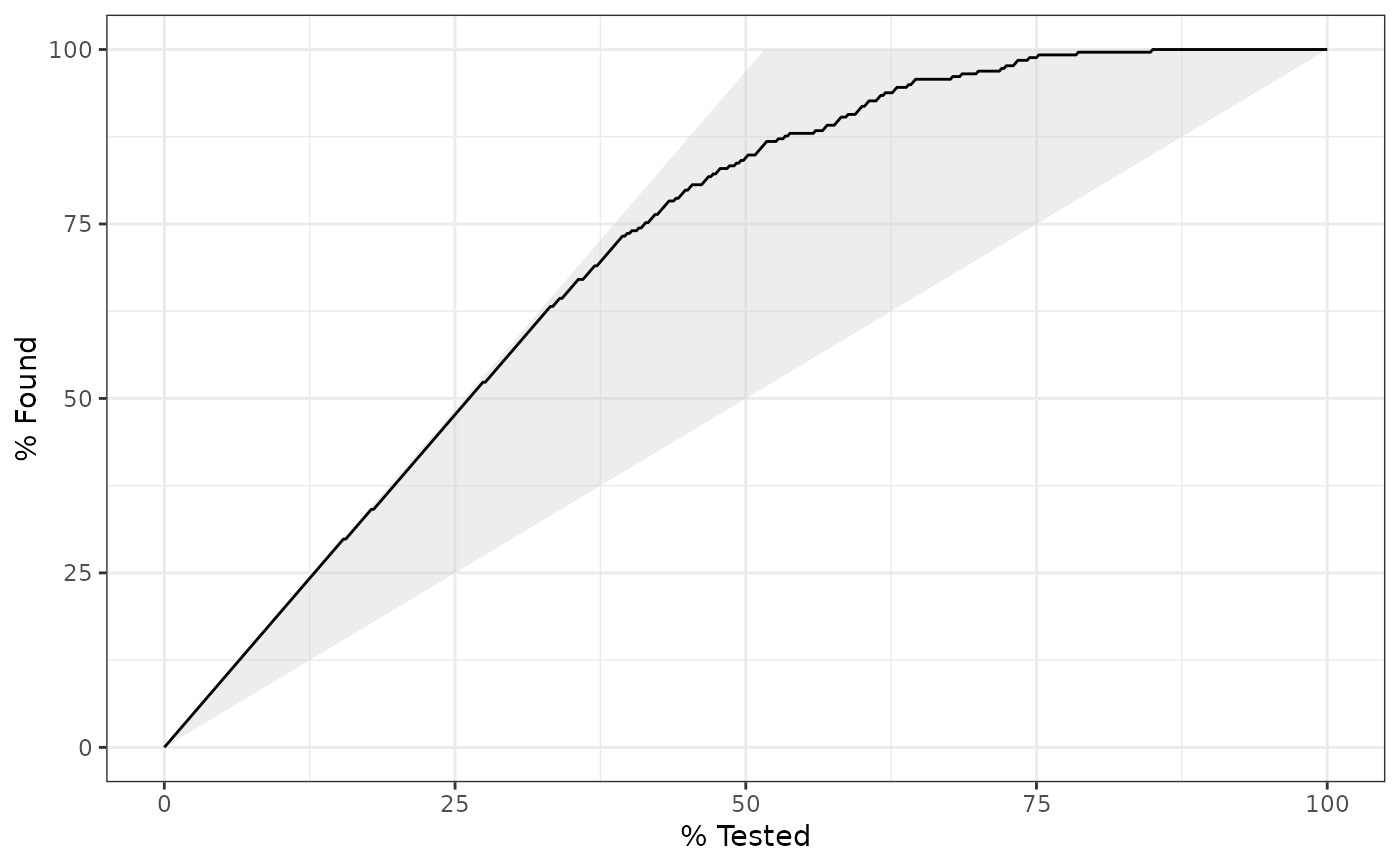
# Visualize gain_capture()
# Visually, this represents the area under the black curve, but above the
# 45 degree line, divided by the area of the shaded triangle.
library(ggplot2)
autoplot(gain_curve(two_class_example, truth, Class1))
相關用法
- R yardstick gain_curve 增益曲線
- R yardstick pr_auc 查準率曲線下麵積
- R yardstick accuracy 準確性
- R yardstick pr_curve 精確率召回曲線
- R yardstick conf_mat 分類數據的混淆矩陣
- R yardstick mn_log_loss 多項數據的平均對數損失
- R yardstick rpd 性能與偏差之比
- R yardstick mae 平均絕對誤差
- R yardstick detection_prevalence 檢測率
- R yardstick bal_accuracy 平衡的精度
- R yardstick rpiq 績效與四分位間的比率
- R yardstick roc_aunp 使用先驗類別分布,每個類別相對於其他類別的 ROC 曲線下麵積
- R yardstick roc_curve 接收者算子曲線
- R yardstick rsq R 平方
- R yardstick msd 平均符號偏差
- R yardstick mpe 平均百分比誤差
- R yardstick iic 相關性理想指數
- R yardstick recall 記起
- R yardstick roc_aunu 使用均勻類別分布,每個類別相對於其他類別的 ROC 曲線下麵積
- R yardstick npv 陰性預測值
- R yardstick rmse 均方根誤差
- R yardstick sens 靈敏度
- R yardstick rsq_trad R 平方 - 傳統
- R yardstick poisson_log_loss 泊鬆數據的平均對數損失
- R yardstick ppv 陽性預測值
注:本文由純淨天空篩選整理自Max Kuhn等大神的英文原創作品 Gain capture。非經特殊聲明,原始代碼版權歸原作者所有,本譯文未經允許或授權,請勿轉載或複製。