Augment 接受模型對象和數據集,並添加有關數據集中每個觀察值的信息。最常見的是,這包括 .fitted 列中的預測值、.resid 列中的殘差以及 .se.fit 列中擬合值的標準誤差。新列始終以 . 前綴開頭,以避免覆蓋原始數據集中的列。
用戶可以通過 data 參數或 newdata 參數傳遞數據以進行增強。如果用戶將數據傳遞給 data 參數,則它必須正是用於擬合模型對象的數據。將數據集傳遞給 newdata 以擴充模型擬合期間未使用的數據。這仍然要求至少存在用於擬合模型的所有預測變量列。如果用於擬合模型的原始結果變量未包含在 newdata 中,則輸出中不會包含 .resid 列。
根據是否給出 data 或 newdata,增強的行為通常會有所不同。這是因為通常存在與訓練觀察(例如影響或相關)測量相關的信息,而這些信息對於新觀察沒有有意義的定義。
為了方便起見,許多增強方法提供默認的 data 參數,以便 augment(fit) 將返回增強的訓練數據。在這些情況下,augment 嘗試根據模型對象重建原始數據,並取得了不同程度的成功。
增強數據集始終以 tibble::tibble 形式返回,其行數與傳遞的數據集相同。這意味著傳遞的數據必須可強製轉換為 tibble。如果預測變量將模型作為協變量矩陣的一部分輸入,例如當模型公式使用 splines::ns() 、 stats::poly() 或 survival::Surv() 時,它會表示為矩陣列。
我們正在定義適合各種 na.action 參數的模型的行為,但目前不保證數據丟失時的行為。
參數
- x
-
從
stats::nls()返回的nls對象。 - data
-
base::data.frame 或
tibble::tibble()包含用於生成對象x的原始數據。默認為stats::model.frame(x),以便augment(my_fit)返回增強的原始數據。不要將新數據傳遞給data參數。增強將報告傳遞給data參數的數據的影響和烹飪距離等信息。這些度量僅針對原始訓練數據定義。 - newdata
-
base::data.frame()或tibble::tibble()包含用於創建x的所有原始預測變量。默認為NULL,表示沒有任何內容傳遞給newdata。如果指定了newdata,則data參數將被忽略。 - ...
-
附加參數。不曾用過。僅需要匹配通用簽名。注意:拚寫錯誤的參數將被吸收到
...中,並被忽略。如果拚寫錯誤的參數有默認值,則將使用默認值。例如,如果您傳遞conf.lvel = 0.9,所有計算將使用conf.level = 0.95進行。這裏有兩個異常:
也可以看看
tidy、stats::nls()、stats::predict.nls()
其他 nls 整理器:glance.nls() 、tidy.nls()
例子
# fit model
n <- nls(mpg ~ k * e^wt, data = mtcars, start = list(k = 1, e = 2))
# summarize model fit with tidiers + visualization
tidy(n)
#> # A tibble: 2 × 5
#> term estimate std.error statistic p.value
#> <chr> <dbl> <dbl> <dbl> <dbl>
#> 1 k 49.7 3.79 13.1 5.96e-14
#> 2 e 0.746 0.0199 37.5 8.86e-27
augment(n)
#> # A tibble: 32 × 4
#> mpg wt .fitted .resid
#> <dbl> <dbl> <dbl> <dbl>
#> 1 21 2.62 23.0 -2.01
#> 2 21 2.88 21.4 -0.352
#> 3 22.8 2.32 25.1 -2.33
#> 4 21.4 3.22 19.3 2.08
#> 5 18.7 3.44 18.1 0.611
#> 6 18.1 3.46 18.0 0.117
#> 7 14.3 3.57 17.4 -3.11
#> 8 24.4 3.19 19.5 4.93
#> 9 22.8 3.15 19.7 3.10
#> 10 19.2 3.44 18.1 1.11
#> # ℹ 22 more rows
glance(n)
#> # A tibble: 1 × 9
#> sigma isConv finTol logLik AIC BIC deviance df.residual nobs
#> <dbl> <lgl> <dbl> <dbl> <dbl> <dbl> <dbl> <int> <int>
#> 1 2.67 TRUE 0.00000204 -75.8 158. 162. 214. 30 32
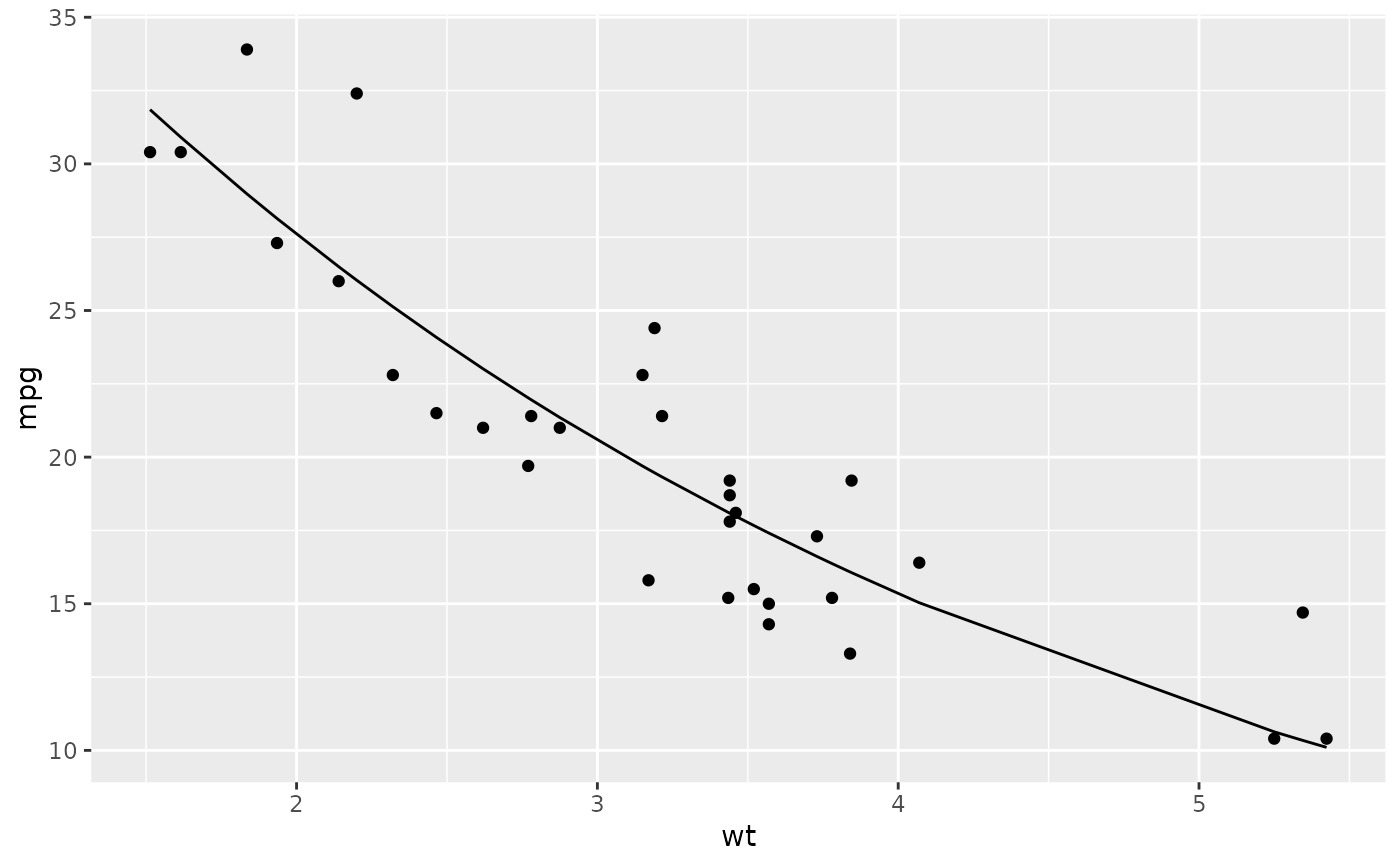
library(ggplot2)
ggplot(augment(n), aes(wt, mpg)) +
geom_point() +
geom_line(aes(y = .fitted))
 newdata <- head(mtcars)
newdata$wt <- newdata$wt + 1
augment(n, newdata = newdata)
#> # A tibble: 6 × 13
#> .rownames mpg cyl disp hp drat wt qsec vs am gear
#> <chr> <dbl> <dbl> <dbl> <dbl> <dbl> <dbl> <dbl> <dbl> <dbl> <dbl>
#> 1 Mazda RX4 21 6 160 110 3.9 3.62 16.5 0 1 4
#> 2 Mazda RX4 W… 21 6 160 110 3.9 3.88 17.0 0 1 4
#> 3 Datsun 710 22.8 4 108 93 3.85 3.32 18.6 1 1 4
#> 4 Hornet 4 Dr… 21.4 6 258 110 3.08 4.22 19.4 1 0 3
#> 5 Hornet Spor… 18.7 8 360 175 3.15 4.44 17.0 0 0 3
#> 6 Valiant 18.1 6 225 105 2.76 4.46 20.2 1 0 3
#> # ℹ 2 more variables: carb <dbl>, .fitted <dbl>
newdata <- head(mtcars)
newdata$wt <- newdata$wt + 1
augment(n, newdata = newdata)
#> # A tibble: 6 × 13
#> .rownames mpg cyl disp hp drat wt qsec vs am gear
#> <chr> <dbl> <dbl> <dbl> <dbl> <dbl> <dbl> <dbl> <dbl> <dbl> <dbl>
#> 1 Mazda RX4 21 6 160 110 3.9 3.62 16.5 0 1 4
#> 2 Mazda RX4 W… 21 6 160 110 3.9 3.88 17.0 0 1 4
#> 3 Datsun 710 22.8 4 108 93 3.85 3.32 18.6 1 1 4
#> 4 Hornet 4 Dr… 21.4 6 258 110 3.08 4.22 19.4 1 0 3
#> 5 Hornet Spor… 18.7 8 360 175 3.15 4.44 17.0 0 0 3
#> 6 Valiant 18.1 6 225 105 2.76 4.46 20.2 1 0 3
#> # ℹ 2 more variables: carb <dbl>, .fitted <dbl>
相關用法
- R broom augment.nlrq 整理 a(n) nlrq 對象
- R broom augment.betamfx 使用來自 betamfx 對象的信息增強數據
- R broom augment.robustbase.glmrob 使用來自 glmrob 對象的信息增強數據
- R broom augment.rlm 使用來自 rlm 對象的信息增強數據
- R broom augment.htest 使用來自(n)個 htest 對象的信息來增強數據
- R broom augment.clm 使用來自 clm 對象的信息增強數據
- R broom augment.speedlm 使用來自 speedlm 對象的信息增強數據
- R broom augment.felm 使用來自 (n) 個 felm 對象的信息來增強數據
- R broom augment.smooth.spline 整理一個(n)smooth.spline對象
- R broom augment.drc 使用來自 a(n) drc 對象的信息增強數據
- R broom augment.decomposed.ts 使用來自 decomposed.ts 對象的信息增強數據
- R broom augment.poLCA 使用來自 poLCA 對象的信息增強數據
- R broom augment.lm 使用來自 (n) lm 對象的信息增強數據
- R broom augment.rqs 使用來自 (n) 個 rqs 對象的信息來增強數據
- R broom augment.polr 使用來自 (n) 個 polr 對象的信息增強數據
- R broom augment.plm 使用來自 plm 對象的信息增強數據
- R broom augment.gam 使用來自 gam 對象的信息增強數據
- R broom augment.fixest 使用來自(n)個最固定對象的信息來增強數據
- R broom augment.survreg 使用來自 survreg 對象的信息增強數據
- R broom augment.rq 使用來自 a(n) rq 對象的信息增強數據
- R broom augment.Mclust 使用來自 Mclust 對象的信息增強數據
- R broom augment.robustbase.lmrob 使用來自 lmrob 對象的信息增強數據
- R broom augment.lmRob 使用來自 lmRob 對象的信息增強數據
- R broom augment.mlogit 使用來自 mlogit 對象的信息增強數據
- R broom augment.betareg 使用來自 betareg 對象的信息增強數據
注:本文由純淨天空篩選整理自等大神的英文原創作品 Augment data with information from a(n) nls object。非經特殊聲明,原始代碼版權歸原作者所有,本譯文未經允許或授權,請勿轉載或複製。