本文簡要介紹 python 語言中 scipy.signal.iircomb 的用法。
用法:
scipy.signal.iircomb(w0, Q, ftype='notch', fs=2.0, *, pass_zero=False)#設計 IIR 陷波或峰值數字梳狀濾波器。
陷波梳狀濾波器由窄帶寬(高品質因數)的 regularly-spaced band-stop 濾波器組成。每個都抑製一個窄頻帶,而其餘頻譜幾乎沒有變化。
峰化梳狀濾波器由窄帶寬(高品質因數)的 regularly-spaced band-pass 濾波器組成。每個都抑製窄頻帶之外的分量。
- w0: 浮點數
梳狀濾波器的基頻(其峰值之間的間距)。這必須均勻劃分采樣頻率。如果fs已指定,其單位與fs.默認情況下,它是一個標準化的標量,必須滿足
0 < w0 < 1, 和w0 = 1對應於采樣頻率的一半。- Q: 浮點數
品質因數。表征陷波濾波器 -3 dB 帶寬
bw相對於其中心頻率Q = w0/bw的無量綱參數。- ftype: {‘notch’, ‘peak’}
該函數生成的梳狀濾波器的類型。如果‘notch’,則 Q 因子適用於凹口。如果‘peak’,則 Q 因子適用於峰值。默認為‘notch’。
- fs: 浮點數,可選
信號的采樣頻率。默認值為 2.0。
- pass_zero: 布爾型,可選
如果為 False(默認值),則濾波器的凹口(空值)以頻率 [0, w0, 2*w0, …] 為中心,峰值以中點 [w0/2, 3*w0/2, 5] 為中心*w0/2,...]。如果為 True,則峰值以 [0, w0, 2*w0, …] 為中心(通過零頻率),反之亦然。
- b, a: 數組,數組
IIR 濾波器的分子 (
b) 和分母 (a) 多項式。
- ValueError
如果w0小於或等於 0 或大於或等於
fs/2, 如果fs不能被w0, 如果類型不是‘notch’ 或‘peak’
參數 ::
返回 ::
拋出 ::
注意:
實現細節見[1]。由於使用了單個重複極點,因此梳狀濾波器的 TF 實現即使在更高階數上也是數值穩定的,不會遭受精度損失。
參考:
[1]Sophocles J. Orfanidis,“信號處理簡介”,Prentice-Hall,1996 年,第 1 章11、“Digital Filter Design”
例子:
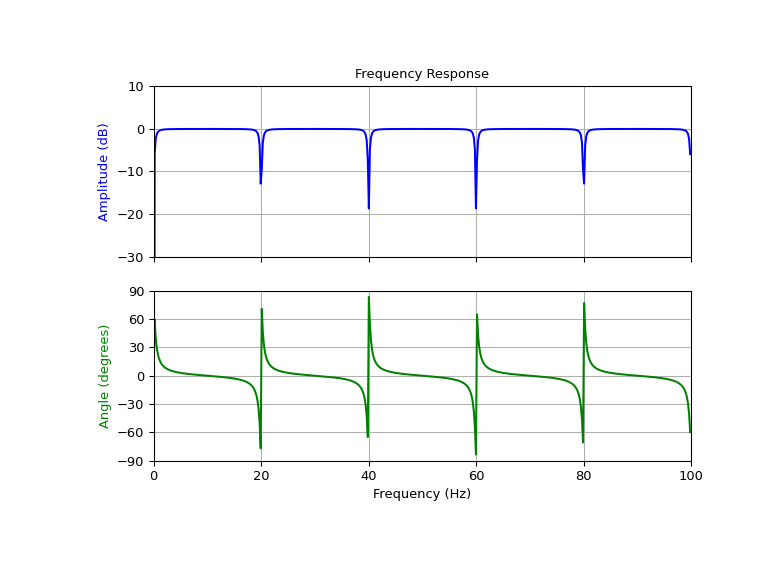
使用品質因數 Q = 30 設計並繪製 20 Hz 的陷波梳狀濾波器,用於以 200 Hz 采樣的信號
>>> from scipy import signal
>>> import matplotlib.pyplot as plt
>>> import numpy as np
>>> fs = 200.0 # Sample frequency (Hz) >>> f0 = 20.0 # Frequency to be removed from signal (Hz) >>> Q = 30.0 # Quality factor >>> # Design notching comb filter >>> b, a = signal.iircomb(f0, Q, ftype='notch', fs=fs)>>> # Frequency response >>> freq, h = signal.freqz(b, a, fs=fs) >>> response = abs(h) >>> # To avoid divide by zero when graphing >>> response[response == 0] = 1e-20 >>> # Plot >>> fig, ax = plt.subplots(2, 1, figsize=(8, 6), sharex=True) >>> ax[0].plot(freq, 20*np.log10(abs(response)), color='blue') >>> ax[0].set_title("Frequency Response") >>> ax[0].set_ylabel("Amplitude (dB)", color='blue') >>> ax[0].set_xlim([0, 100]) >>> ax[0].set_ylim([-30, 10]) >>> ax[0].grid(True) >>> ax[1].plot(freq, (np.angle(h)*180/np.pi+180)%360 - 180, color='green') >>> ax[1].set_ylabel("Angle (degrees)", color='green') >>> ax[1].set_xlabel("Frequency (Hz)") >>> ax[1].set_xlim([0, 100]) >>> ax[1].set_yticks([-90, -60, -30, 0, 30, 60, 90]) >>> ax[1].set_ylim([-90, 90]) >>> ax[1].grid(True) >>> plt.show()
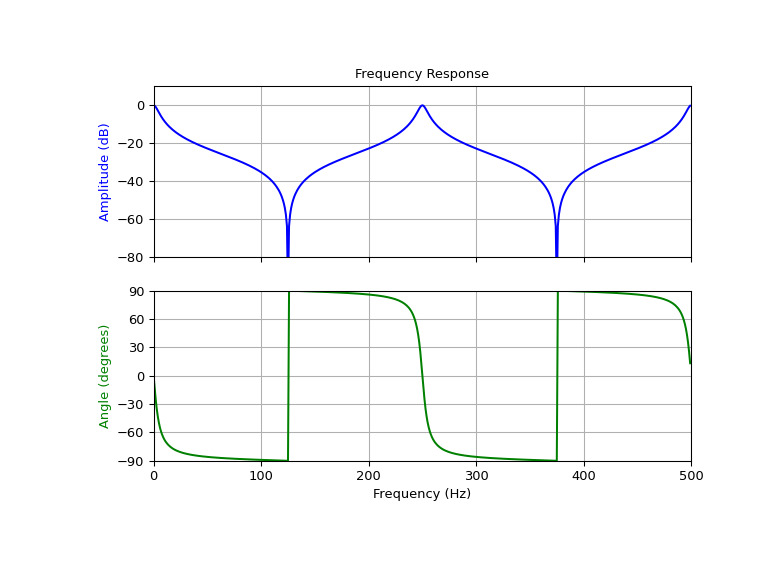
使用品質因數 Q = 30,設計並繪製 250 Hz 處的峰值梳狀濾波器,用於以 1000 Hz 采樣的信號
>>> fs = 1000.0  # Sample frequency (Hz)
>>> f0 = 250.0  # Frequency to be retained (Hz)
>>> Q = 30.0  # Quality factor
>>> # Design peaking filter
>>> b, a = signal.iircomb(f0, Q, ftype='peak', fs=fs, pass_zero=True)
>>> # Frequency response >>> freq, h = signal.freqz(b, a, fs=fs) >>> response = abs(h) >>> # To avoid divide by zero when graphing >>> response[response == 0] = 1e-20 >>> # Plot >>> fig, ax = plt.subplots(2, 1, figsize=(8, 6), sharex=True) >>> ax[0].plot(freq, 20*np.log10(np.maximum(abs(h), 1e-5)), color='blue') >>> ax[0].set_title("Frequency Response") >>> ax[0].set_ylabel("Amplitude (dB)", color='blue') >>> ax[0].set_xlim([0, 500]) >>> ax[0].set_ylim([-80, 10]) >>> ax[0].grid(True) >>> ax[1].plot(freq, (np.angle(h)*180/np.pi+180)%360 - 180, color='green') >>> ax[1].set_ylabel("Angle (degrees)", color='green') >>> ax[1].set_xlabel("Frequency (Hz)") >>> ax[1].set_xlim([0, 500]) >>> ax[1].set_yticks([-90, -60, -30, 0, 30, 60, 90]) >>> ax[1].set_ylim([-90, 90]) >>> ax[1].grid(True) >>> plt.show()
相關用法
- Python SciPy signal.iirdesign用法及代碼示例
- Python SciPy signal.iirfilter用法及代碼示例
- Python SciPy signal.iirnotch用法及代碼示例
- Python SciPy signal.iirpeak用法及代碼示例
- Python SciPy signal.impulse用法及代碼示例
- Python SciPy signal.impulse2用法及代碼示例
- Python SciPy signal.invresz用法及代碼示例
- Python SciPy signal.istft用法及代碼示例
- Python SciPy signal.invres用法及代碼示例
- Python SciPy signal.czt_points用法及代碼示例
- Python SciPy signal.chirp用法及代碼示例
- Python SciPy signal.residue用法及代碼示例
- Python SciPy signal.max_len_seq用法及代碼示例
- Python SciPy signal.kaiser_atten用法及代碼示例
- Python SciPy signal.oaconvolve用法及代碼示例
- Python SciPy signal.hilbert用法及代碼示例
- Python SciPy signal.ricker用法及代碼示例
- Python SciPy signal.group_delay用法及代碼示例
- Python SciPy signal.cheb2ord用法及代碼示例
- Python SciPy signal.get_window用法及代碼示例
- Python SciPy signal.lfilter用法及代碼示例
- Python SciPy signal.morlet用法及代碼示例
- Python SciPy signal.coherence用法及代碼示例
- Python SciPy signal.dfreqresp用法及代碼示例
- Python SciPy signal.TransferFunction用法及代碼示例
注:本文由純淨天空篩選整理自scipy.org大神的英文原創作品 scipy.signal.iircomb。非經特殊聲明,原始代碼版權歸原作者所有,本譯文未經允許或授權,請勿轉載或複製。
