用法:
Series.plot.pie(**kwargs)生成餅圖。
餅圖是列中數值數據的比例表示。此函數為指定列包裝
matplotlib.pyplot.pie()。如果沒有傳遞列引用並且subplots=True為每個數字列獨立繪製餅圖。- y:整數或標簽,可選
要繪製的列的標簽或位置。如果未提供,則必須傳遞
subplots=True參數。- **kwargs:
要傳遞給
DataFrame.plot()的關鍵字參數。
- matplotlib.axes.Axes 或它們的 np.ndarray
當
subplots為 True 時,返回一個 NumPy 數組。
參數:
返回:
例子:
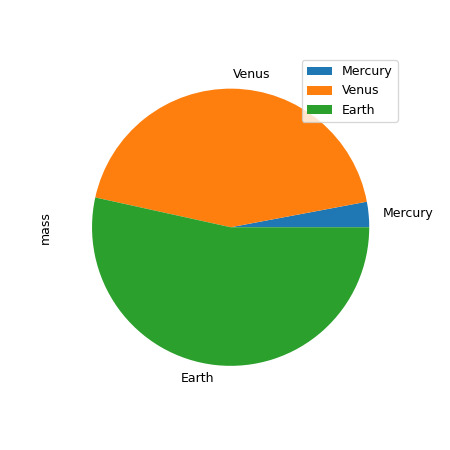
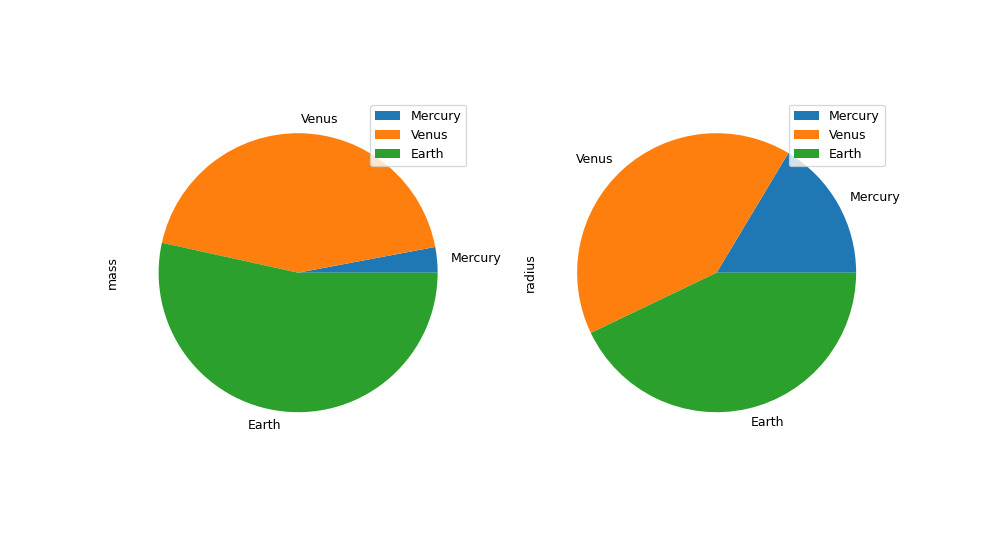
在下麵的示例中,我們有一個 DataFrame,其中包含有關行星質量和半徑的信息。我們將‘mass’ 列傳遞給餅函數以獲得餅圖。
>>> df = pd.DataFrame({'mass': [0.330, 4.87 , 5.97],
...                    'radius': [2439.7, 6051.8, 6378.1]},
...                   index=['Mercury', 'Venus', 'Earth'])
>>> plot = df.plot.pie(y='mass', figsize=(5, 5))
>>> plot = df.plot.pie(subplots=True, figsize=(11, 6))
相關用法
- Python pandas.Series.plot.line用法及代碼示例
- Python pandas.Series.plot.hist用法及代碼示例
- Python pandas.Series.plot.box用法及代碼示例
- Python pandas.Series.plot.kde用法及代碼示例
- Python pandas.Series.plot.bar用法及代碼示例
- Python pandas.Series.plot.area用法及代碼示例
- Python pandas.Series.plot.barh用法及代碼示例
- Python pandas.Series.plot.density用法及代碼示例
- Python pandas.Series.pop用法及代碼示例
- Python pandas.Series.pow用法及代碼示例
- Python pandas.Series.product用法及代碼示例
- Python pandas.Series.pipe用法及代碼示例
- Python pandas.Series.pct_change用法及代碼示例
- Python pandas.Series.prod用法及代碼示例
- Python pandas.Series.add_prefix用法及代碼示例
- Python pandas.Series.map用法及代碼示例
- Python pandas.Series.max用法及代碼示例
- Python pandas.Series.str.isdecimal用法及代碼示例
- Python pandas.Series.str.get用法及代碼示例
- Python pandas.Series.to_csv用法及代碼示例
注:本文由純淨天空篩選整理自pandas.pydata.org大神的英文原創作品 pandas.Series.plot.pie。非經特殊聲明,原始代碼版權歸原作者所有,本譯文未經允許或授權,請勿轉載或複製。
