用法:
Series.plot.area(x=None, y=None, **kwargs)繪製堆積麵積圖。
麵積圖直觀地顯示定量數據。該函數包裝了 matplotlib 區域函數。
- x:標簽或位置,可選
X 軸的坐標。默認情況下使用索引。
- y:標簽或位置,可選
要繪製的列。默認情況下使用所有列。
- stacked:布爾值,默認為真
默認情況下,麵積圖是堆疊的。設置為 False 以創建非堆疊圖。
- **kwargs:
其他關鍵字參數記錄在
DataFrame.plot()中。
- matplotlib.axes.Axes 或 numpy.ndarray
麵積圖,如果 subplots 為 True,則為麵積圖數組。
參數:
返回:
例子:
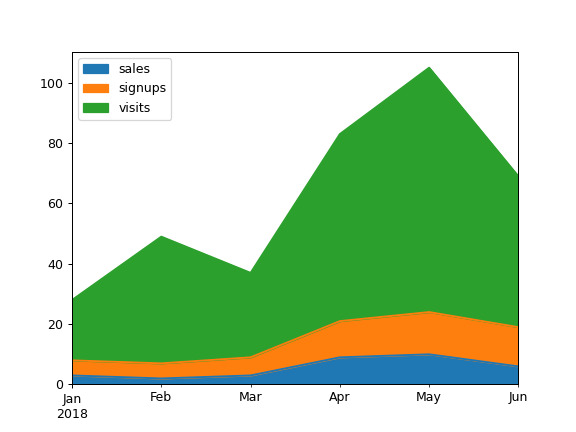
根據基本業務指標繪製麵積圖:
>>> df = pd.DataFrame({
...     'sales': [3, 2, 3, 9, 10, 6],
...     'signups': [5, 5, 6, 12, 14, 13],
...     'visits': [20, 42, 28, 62, 81, 50],
... }, index=pd.date_range(start='2018/01/01', end='2018/07/01',
...                        freq='M'))
>>> ax = df.plot.area()
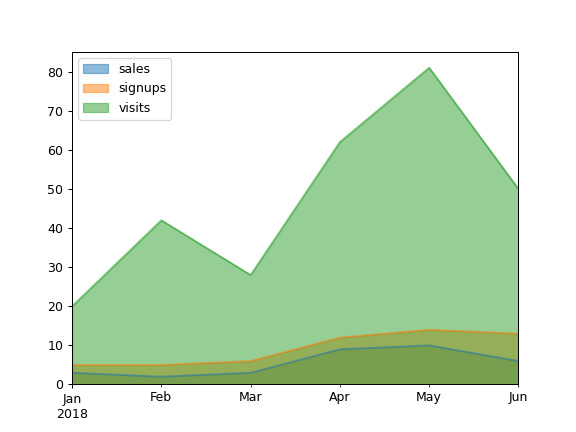
默認情況下,麵積圖是堆疊的。要生成非堆疊圖,請傳遞
stacked=False:>>> ax = df.plot.area(stacked=False)
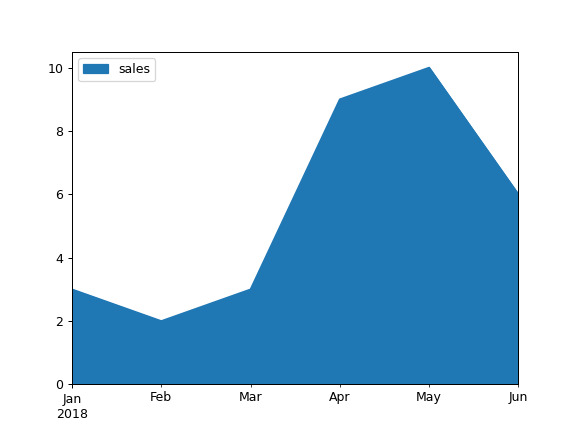
為單列繪製麵積圖:
>>> ax = df.plot.area(y='sales')
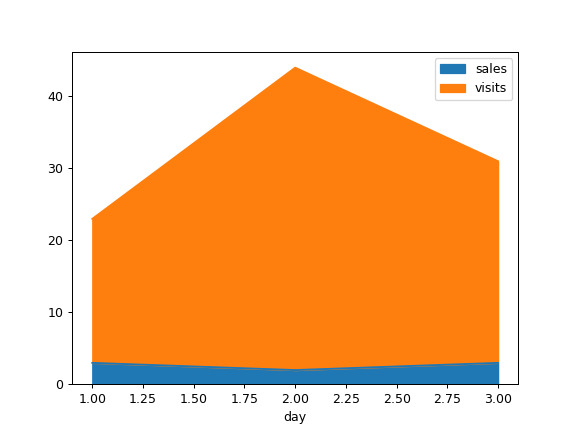
使用不同的
x繪製:>>> df = pd.DataFrame({ ... 'sales': [3, 2, 3], ... 'visits': [20, 42, 28], ... 'day': [1, 2, 3], ... }) >>> ax = df.plot.area(x='day')
相關用法
- Python pandas.Series.plot.line用法及代碼示例
- Python pandas.Series.plot.hist用法及代碼示例
- Python pandas.Series.plot.box用法及代碼示例
- Python pandas.Series.plot.kde用法及代碼示例
- Python pandas.Series.plot.pie用法及代碼示例
- Python pandas.Series.plot.bar用法及代碼示例
- Python pandas.Series.plot.barh用法及代碼示例
- Python pandas.Series.plot.density用法及代碼示例
- Python pandas.Series.pop用法及代碼示例
- Python pandas.Series.pow用法及代碼示例
- Python pandas.Series.product用法及代碼示例
- Python pandas.Series.pipe用法及代碼示例
- Python pandas.Series.pct_change用法及代碼示例
- Python pandas.Series.prod用法及代碼示例
- Python pandas.Series.add_prefix用法及代碼示例
- Python pandas.Series.map用法及代碼示例
- Python pandas.Series.max用法及代碼示例
- Python pandas.Series.str.isdecimal用法及代碼示例
- Python pandas.Series.str.get用法及代碼示例
- Python pandas.Series.to_csv用法及代碼示例
注:本文由純淨天空篩選整理自pandas.pydata.org大神的英文原創作品 pandas.Series.plot.area。非經特殊聲明,原始代碼版權歸原作者所有,本譯文未經允許或授權,請勿轉載或複製。
