Tidy 总结了有关模型组件的信息。模型组件可能是回归中的单个项、单个假设、聚类或类。 tidy 所认为的模型组件的确切含义因模型而异,但通常是不言而喻的。如果模型具有多种不同类型的组件,您将需要指定要返回哪些组件。
参数
- x
-
从
maps::map()返回的map对象。 - ...
-
附加参数。不曾用过。仅需要匹配通用签名。注意:拼写错误的参数将被吸收到
...中,并被忽略。如果拼写错误的参数有默认值,则将使用默认值。例如,如果您传递conf.lvel = 0.9,所有计算将使用conf.level = 0.95进行。这里有两个异常:
值
带有列的 tibble::tibble():
- term
-
回归项的名称。
- long
-
经度。
- lat
-
纬度。
其余列提供有关地理属性的信息,并取决于输入的Map对象。请参阅 ?maps::map 了解更多信息。
例子
# load libraries for models and data
library(maps)
#>
#> Attaching package: ‘maps’
#> The following object is masked from ‘package:cluster’:
#>
#> votes.repub
#> The following object is masked from ‘package:purrr’:
#>
#> map
#> The following object is masked from ‘package:mclust’:
#>
#> map
library(ggplot2)
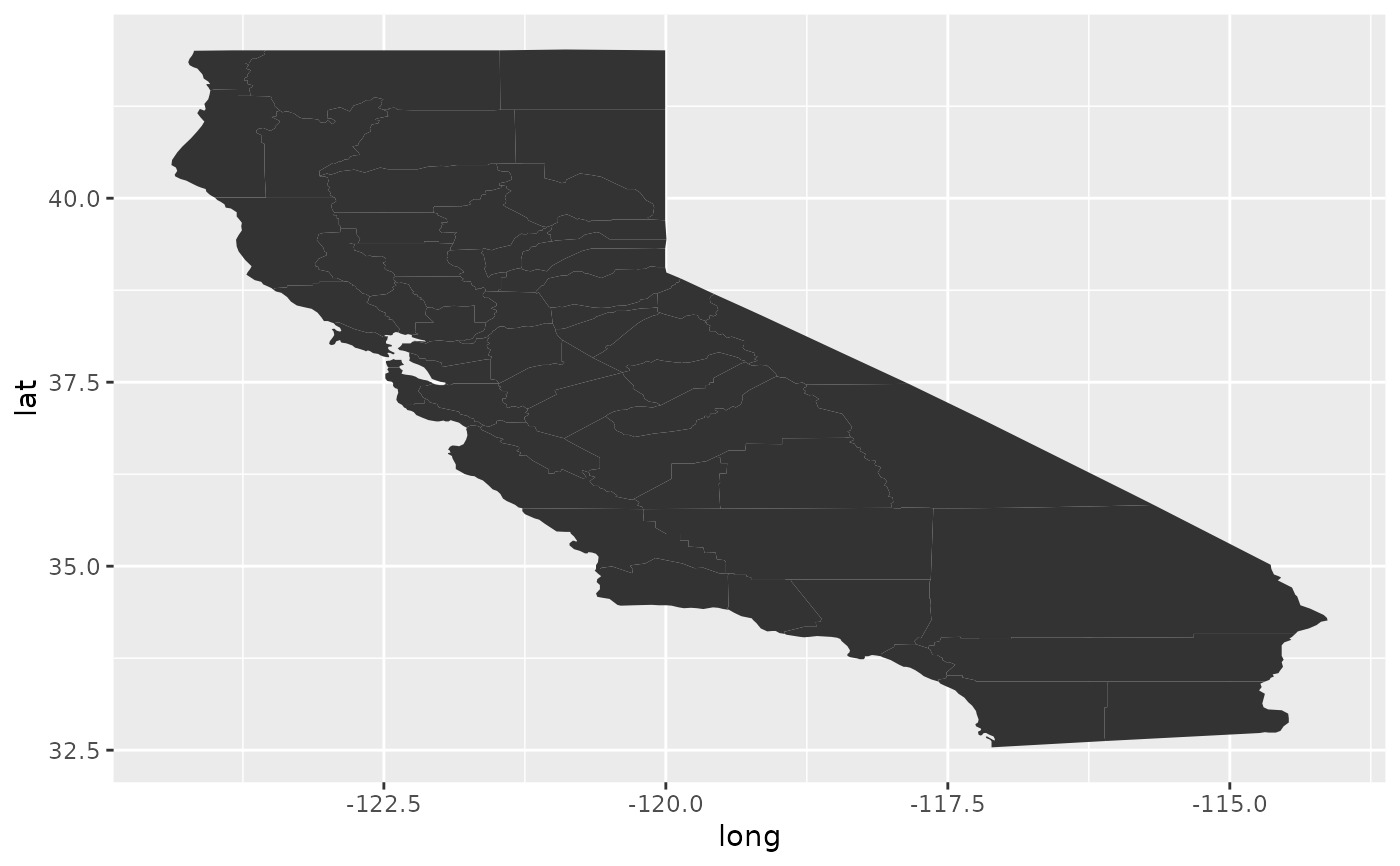
ca <- map("county", "ca", plot = FALSE, fill = TRUE)
tidy(ca)
#> # A tibble: 2,977 × 7
#> term long lat group order region subregion
#> <chr> <dbl> <dbl> <dbl> <int> <chr> <chr>
#> 1 1 -121. 37.5 1 1 california alameda
#> 2 2 -122. 37.5 1 2 california alameda
#> 3 3 -122. 37.5 1 3 california alameda
#> 4 4 -122. 37.5 1 4 california alameda
#> 5 5 -122. 37.5 1 5 california alameda
#> 6 6 -122. 37.5 1 6 california alameda
#> 7 7 -122. 37.5 1 7 california alameda
#> 8 8 -122. 37.5 1 8 california alameda
#> 9 9 -122. 37.5 1 9 california alameda
#> 10 10 -122. 37.5 1 10 california alameda
#> # ℹ 2,967 more rows
qplot(long, lat, data = ca, geom = "polygon", group = group)
#> Warning: `qplot()` was deprecated in ggplot2 3.4.0.
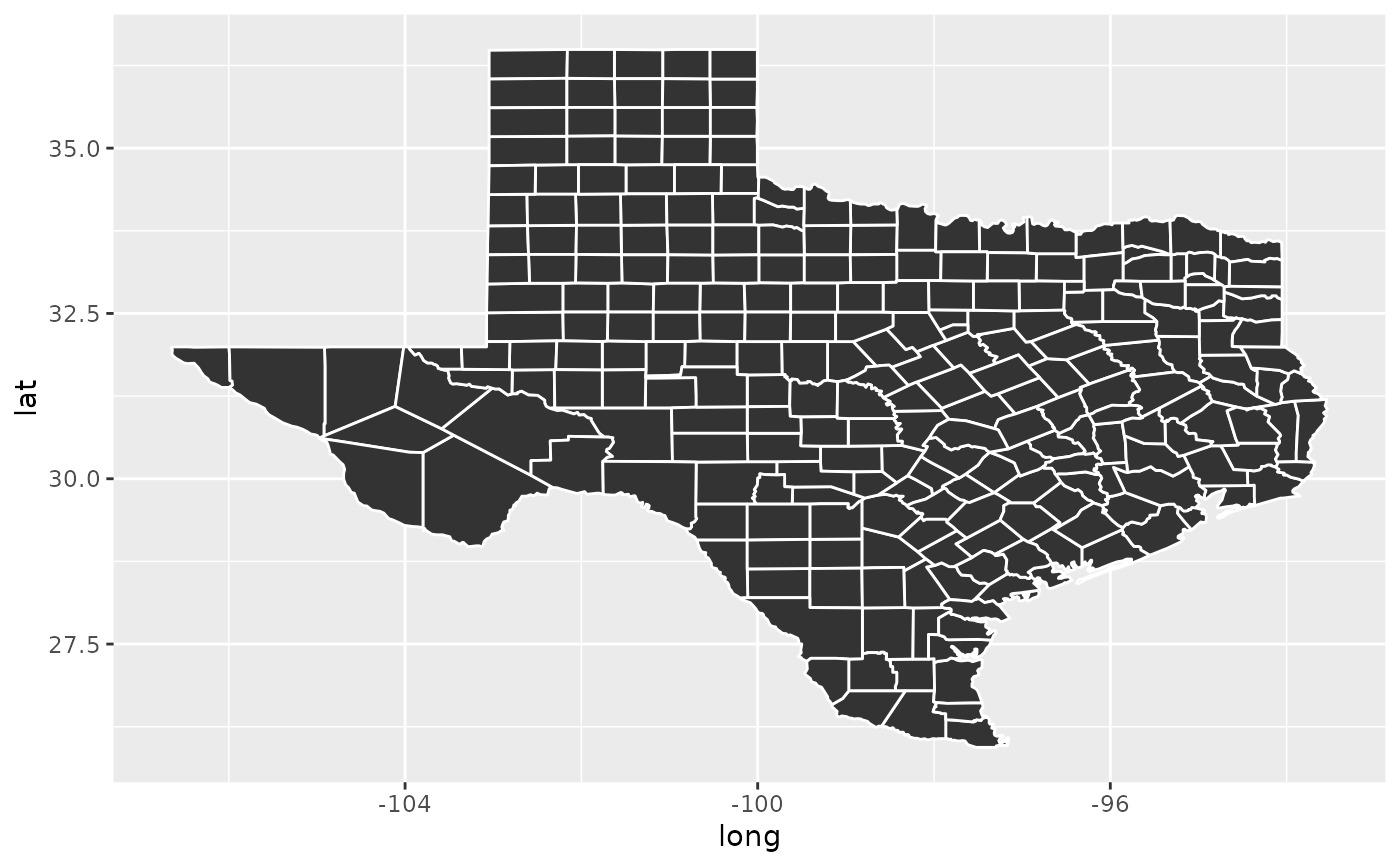
 tx <- map("county", "texas", plot = FALSE, fill = TRUE)
tidy(tx)
#> # A tibble: 4,488 × 7
#> term long lat group order region subregion
#> <chr> <dbl> <dbl> <dbl> <int> <chr> <chr>
#> 1 1 -95.8 31.5 1 1 texas anderson
#> 2 2 -95.8 31.6 1 2 texas anderson
#> 3 3 -95.8 31.6 1 3 texas anderson
#> 4 4 -95.7 31.6 1 4 texas anderson
#> 5 5 -95.7 31.6 1 5 texas anderson
#> 6 6 -95.7 31.6 1 6 texas anderson
#> 7 7 -95.8 31.7 1 7 texas anderson
#> 8 8 -95.8 31.7 1 8 texas anderson
#> 9 9 -95.8 31.6 1 9 texas anderson
#> 10 10 -95.8 31.6 1 10 texas anderson
#> # ℹ 4,478 more rows
qplot(long, lat,
data = tx, geom = "polygon", group = group,
colour = I("white")
)
tx <- map("county", "texas", plot = FALSE, fill = TRUE)
tidy(tx)
#> # A tibble: 4,488 × 7
#> term long lat group order region subregion
#> <chr> <dbl> <dbl> <dbl> <int> <chr> <chr>
#> 1 1 -95.8 31.5 1 1 texas anderson
#> 2 2 -95.8 31.6 1 2 texas anderson
#> 3 3 -95.8 31.6 1 3 texas anderson
#> 4 4 -95.7 31.6 1 4 texas anderson
#> 5 5 -95.7 31.6 1 5 texas anderson
#> 6 6 -95.7 31.6 1 6 texas anderson
#> 7 7 -95.8 31.7 1 7 texas anderson
#> 8 8 -95.8 31.7 1 8 texas anderson
#> 9 9 -95.8 31.6 1 9 texas anderson
#> 10 10 -95.8 31.6 1 10 texas anderson
#> # ℹ 4,478 more rows
qplot(long, lat,
data = tx, geom = "polygon", group = group,
colour = I("white")
)
相关用法
- R broom tidy.margins 整理 a(n) 边距对象
- R broom tidy.manova 整理 a(n) 方差分析对象
- R broom tidy.mlogit Logit模型的整理方法
- R broom tidy.mlm 整理 a(n) 传销对象
- R broom tidy.mjoint 整理 a(n) mjoint 对象
- R broom tidy.muhaz 整理 a(n) muhaz 对象
- R broom tidy.mfx 整理 a(n) mfx 对象
- R broom tidy.mediate 整理 a(n) 中介对象
- R broom tidy.mle2 整理 a(n) mle2 对象
- R broom tidy.multinom 多项逻辑回归模型的整理方法
- R broom tidy.robustbase.glmrob 整理 a(n) glmrob 对象
- R broom tidy.acf 整理 a(n) acf 对象
- R broom tidy.robustbase.lmrob 整理 a(n) lmrob 对象
- R broom tidy.biglm 整理 a(n) biglm 对象
- R broom tidy.garch 整理 a(n) garch 对象
- R broom tidy.rq 整理 a(n) rq 对象
- R broom tidy.kmeans 整理 a(n) kmeans 对象
- R broom tidy.betamfx 整理 a(n) betamfx 对象
- R broom tidy.anova 整理 a(n) anova 对象
- R broom tidy.btergm 整理 a(n) btergm 对象
- R broom tidy.cv.glmnet 整理 a(n) cv.glmnet 对象
- R broom tidy.roc 整理 a(n) roc 对象
- R broom tidy.poLCA 整理 a(n) poLCA 对象
- R broom tidy.emmGrid 整理 a(n) emmGrid 对象
- R broom tidy.Kendall 整理 a(n) Kendall 对象
注:本文由纯净天空筛选整理自等大神的英文原创作品 Tidy a(n) map object。非经特殊声明,原始代码版权归原作者所有,本译文未经允许或授权,请勿转载或复制。