本文简要介绍 python 语言中 scipy.ndimage.gaussian_filter 的用法。
用法:
scipy.ndimage.gaussian_filter(input, sigma, order=0, output=None, mode='reflect', cval=0.0, truncate=4.0, *, radius=None, axes=None)#多维高斯滤波器。
- input: array_like
输入数组。
- sigma: 标量或标量序列
高斯核的标准差。每个轴的高斯滤波器的标准偏差作为一个序列或单个数字给出,在这种情况下,它对所有轴都是相等的。
- order: int 或整数序列,可选
过滤器沿每个轴的顺序以整数序列或单个数字的形式给出。 0 阶对应于具有高斯核的卷积。正阶对应于具有高斯导数的卷积。
- output: 数组或数据类型,可选
放置输出的数组,或返回数组的 dtype。默认情况下,将创建一个与输入具有相同 dtype 的数组。
- mode: str 或序列,可选
mode 参数确定当过滤器与边框重叠时如何扩展输入数组。通过传递长度等于输入数组维数的模式序列,可以沿每个轴指定不同的模式。默认值为‘reflect’。有效值及其行为如下:
- ‘reflect’ (d c b a | a b c d | d c b a)
通过反射最后一个像素的边来扩展输入。此模式有时也称为half-sample 对称模式。
- ‘constant’ (k k k k | a b c d |呸呸呸呸)
通过使用 cval 参数定义的相同常量值填充边之外的所有值来扩展输入。
- ‘nearest’ (啊啊啊啊| a b c d |嘀嘀嘀嘀)
通过复制最后一个像素来扩展输入。
- ‘mirror’ (d c b | a b c d | c b a)
通过反射最后一个像素的中心来扩展输入。此模式有时也称为whole-sample 对称模式。
- ‘wrap’ (a b c d | a b c d | A B C D)
通过环绕到相对边来扩展输入。
为了与插值函数保持一致,还可以使用以下模式名称:
- ‘grid-constant’
这是‘constant’ 的同义词。
- ‘grid-mirror’
这是‘reflect’ 的同义词。
- ‘grid-wrap’
这是‘wrap’ 的同义词。
- cval: 标量,可选
如果模式为‘constant’,则填充过去输入边的值。默认值为 0.0。
- truncate: 浮点数,可选
在这么多标准偏差处截断过滤器。默认值为 4.0。
- radius: 无或 int 或整数序列,可选
高斯核的半径。每个轴的半径以序列或单个数字的形式给出,在这种情况下,所有轴的半径都相等。如果指定,则内核沿每个轴的大小将为
2*radius + 1, 和截短被忽略。默认为“无”。- axes: int 或 None 的元组,可选
如果无,则沿所有轴过滤输入。否则,将沿指定轴过滤输入。当指定轴时,用于 sigma、阶、模式和/或半径的任何元组都必须与轴的长度匹配。这些元组中的第 i 个条目对应于轴中的第 i 个条目。
- gaussian_filter: ndarray
返回与形状相同的数组输入.
参数 ::
返回 ::
注意:
多维滤波器被实现为一维卷积滤波器序列。中间数组存储在与输出相同的数据类型中。因此,对于精度有限的输出类型,结果可能不精确,因为存储的中间结果可能精度不足。
高斯核的大小
2*radius + 1沿着每个轴。如果半径为 None,默认值radius = round(truncate * sigma)将会被使用。例子:
>>> from scipy.ndimage import gaussian_filter
>>> import numpy as np
>>> a = np.arange(50, step=2).reshape((5,5))
>>> a
array([[ 0,  2,  4,  6,  8],
       [10, 12, 14, 16, 18],
       [20, 22, 24, 26, 28],
       [30, 32, 34, 36, 38],
       [40, 42, 44, 46, 48]])
>>> gaussian_filter(a, sigma=1)
array([[ 4,  6,  8,  9, 11],
       [10, 12, 14, 15, 17],
       [20, 22, 24, 25, 27],
       [29, 31, 33, 34, 36],
       [35, 37, 39, 40, 42]])
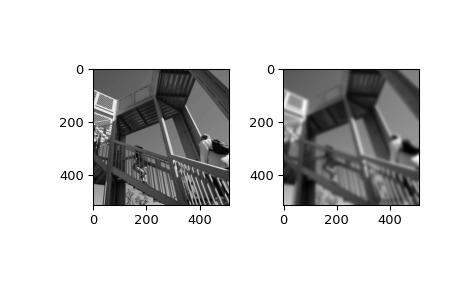
>>> from scipy import datasets >>> import matplotlib.pyplot as plt >>> fig = plt.figure() >>> plt.gray() # show the filtered result in grayscale >>> ax1 = fig.add_subplot(121) # left side >>> ax2 = fig.add_subplot(122) # right side >>> ascent = datasets.ascent() >>> result = gaussian_filter(ascent, sigma=5) >>> ax1.imshow(ascent) >>> ax2.imshow(result) >>> plt.show()
相关用法
- Python SciPy ndimage.gaussian_filter1d用法及代码示例
- Python SciPy ndimage.gaussian_laplace用法及代码示例
- Python SciPy ndimage.gaussian_gradient_magnitude用法及代码示例
- Python SciPy ndimage.generic_laplace用法及代码示例
- Python SciPy ndimage.generate_binary_structure用法及代码示例
- Python SciPy ndimage.grey_erosion用法及代码示例
- Python SciPy ndimage.generic_filter1d用法及代码示例
- Python SciPy ndimage.generic_gradient_magnitude用法及代码示例
- Python SciPy ndimage.generic_filter用法及代码示例
- Python SciPy ndimage.grey_closing用法及代码示例
- Python SciPy ndimage.grey_opening用法及代码示例
- Python SciPy ndimage.geometric_transform用法及代码示例
- Python SciPy ndimage.grey_dilation用法及代码示例
- Python SciPy ndimage.correlate用法及代码示例
- Python SciPy ndimage.morphological_gradient用法及代码示例
- Python SciPy ndimage.variance用法及代码示例
- Python SciPy ndimage.correlate1d用法及代码示例
- Python SciPy ndimage.binary_dilation用法及代码示例
- Python SciPy ndimage.distance_transform_bf用法及代码示例
- Python SciPy ndimage.find_objects用法及代码示例
- Python SciPy ndimage.label用法及代码示例
- Python SciPy ndimage.maximum_filter1d用法及代码示例
- Python SciPy ndimage.iterate_structure用法及代码示例
- Python SciPy ndimage.map_coordinates()用法及代码示例
- Python SciPy ndimage.binary_opening用法及代码示例
注:本文由纯净天空筛选整理自scipy.org大神的英文原创作品 scipy.ndimage.gaussian_filter。非经特殊声明,原始代码版权归原作者所有,本译文未经允许或授权,请勿转载或复制。
