Matplotlib是Python中令人惊叹的可视化库,用于数组的二维图。 Matplotlib是一个基于NumPy数组的多平台数据可视化库,旨在与更广泛的SciPy堆栈配合使用。
matplotlib.ticker.AutoMinorLocator
这个matplotlib.ticker.AutoMinorLocator类用于根据主要引号的位置动态查找次要引号位置。主刻度线需要与线性刻度均匀地间隔开。
用法:class matplotlib.ticker.AutoMinorLocator(n=None)
parameter:
- n:它表示主要刻度之间的时间间隔的细分数量。如果省略n或无,它将自动设置为5或4。
该类的方法:
- tick_values(self,vmin,vmax):在给定vmin和vmax的情况下,它返回所定位的引号的值。
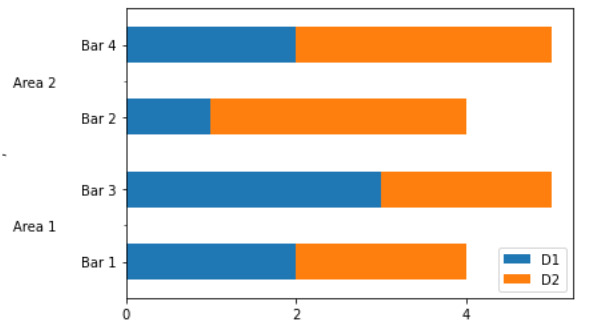
范例1:
import pandas as pd
import matplotlib.pyplot as plt
from matplotlib import ticker

data = [
    ('Area 1', 'Bar 1', 2, 2),
    ('Area 2', 'Bar 2', 1, 3),
    ('Area 1', 'Bar 3', 3, 2),
    ('Area 2', 'Bar 4', 2, 3),
]

df = pd.DataFrame(data, columns =('A', 'B',
                                  'D1', 'D2'))

df = df.set_index(['A', 'B'])
df.sort_index(inplace = True)

# Remove the index names for the plot,
# or it'll be used as the axis label
df.index.names = ['', '']

ax = df.plot(kind ='barh', stacked = True)

minor_locator = ticker.AutoMinorLocator(2)

ax.yaxis.set_minor_locator(minor_locator)

ax.set_yticklabels(df.index.get_level_values(1))
ax.set_yticklabels(df.index.get_level_values(0).unique(),
                   minor = True)

ax.set_yticks(np.arange(0.5, len(df), 2),
              minor = True)

ax.tick_params(axis ='y', which ='minor',
               direction ='out', pad = 50)

plt.show()
输出:
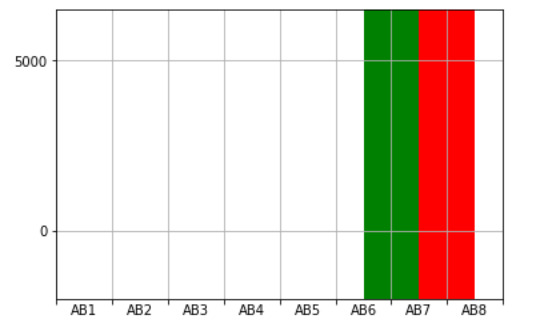
范例2:
from pylab import *
import matplotlib
import matplotlib.ticker as ticker


# Setting minor ticker size to 0,
# globally.
matplotlib.rcParams['xtick.minor.size'] = 0

# Create a figure with just one
# subplot.
fig = figure()
ax = fig.add_subplot(111)

# Set both X and Y limits so that
# matplotlib
ax.set_xlim(0, 800)

# Fixes the major ticks to the places
# where desired (one every hundred units)
ax.xaxis.set_major_locator(ticker.FixedLocator(range(0,
                                                     801,
                                                     100)))
ax.xaxis.set_major_formatter(ticker.NullFormatter())

# Add minor tickers AND labels for them
ax.xaxis.set_minor_locator(ticker.AutoMinorLocator(n = 2))
ax.xaxis.set_minor_formatter(ticker.FixedFormatter(['AB %d' % x
                                                    for x in range(1, 9)]))

ax.set_ylim(-2000, 6500, auto = False)

# common attributes for the bar plots
bcommon = dict(
    height = [8500],
    bottom = -2000,
    width = 100)


bars = [[600, 'green'],
        [700, 'red']]
for left, clr in bars:
    bar([left], color = clr, **bcommon)


show()
输出:
相关用法
- Python Matplotlib.ticker.MultipleLocator用法及代码示例
- Python Matplotlib.gridspec.GridSpec用法及代码示例
- Python Matplotlib.patches.CirclePolygon用法及代码示例
- Python Matplotlib.colors.Normalize用法及代码示例
注:本文由纯净天空筛选整理自RajuKumar19大神的英文原创作品 Matplotlib.ticker.AutoMinorLocator Class in Python。非经特殊声明,原始代码版权归原作者所有,本译文未经允许或授权,请勿转载或复制。