Matplotlib是Python中令人惊叹的可视化库,用于数组的二维图。 Matplotlib是一个基于NumPy数组的多平台数据可视化库,旨在与更广泛的SciPy堆栈配合使用。
matplotlib.gridspec.GridSpec
这个matplotlib.gridspec.GridSpec类用于指定放置子图的网格的几何形状。为此,必须设置行数和列数。可选地,也可以完成子图布局参数的调整。
用法: class matplotlib.gridspec.GridSpec(nrows, ncols, figure=None, left=None, bottom=None, right=None, top=None, wspace=None, hspace=None, width_ratios=None, height_ratios=None)
参数:
- nrows:它是一个整数,代表网格中的行数。
- ncols:它是一个整数,代表网格中的列数。
- figure:它是用于绘制图形的可选参数。
- left, right, top, bottom:这些是可选参数,用于将子图的范围定义为图形宽度或高度的一部分。
- wspase:这是一个可选的float参数,用于保留子图之间的宽度空间。
- hspace:它是一个可选的float参数,用于保留子图之间的高度空间。
- width_ratios:它是一个可选参数,代表列的宽度比率。
- height_ratios:它是一个可选参数,表示行的宽度比率。
该类的方法:
- get_subplot_params(self, figure=None):它返回子图布局参数的字典。除非设置了图形属性,否则默认参数来自rcParams。
- ight_layout(self, figure, renderer=None, pad=1.08, h_pad=None, w_pad=None, rect=None):它用于提供特定的填充以调整子图。这里pad是一个float值,用于将图形边和子图边之间的填充设置为字体大小的一部分。 h_pad和w_pad是可选参数,用于设置相邻子图之间的填充。 rect也用于规范包含所有子图区域的矩形的图形坐标。其默认值为(0,0,1,1)。它是一个由4个浮点数组成的元组。
范例1:
import numpy as np
import matplotlib.pyplot as plt
from matplotlib.gridspec import GridSpec


gs = GridSpec(8, 39)
ax1 = plt.subplot(gs[:6,:35])
ax2 = plt.subplot(gs[6:,:])

data1 = np.random.rand(6, 35)
data2 = np.random.rand(2, 39)

ax1.imshow(data1)
ax2.imshow(data2)

plt.show()
输出:

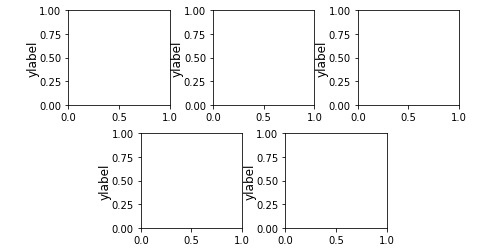
范例2:
import matplotlib.pyplot as plt
import matplotlib.gridspec as gridspec


fig = plt.figure(figsize =([7, 4]))

gs = gridspec.GridSpec(2, 6)
gs.update(wspace = 1.5, hspace = 0.3)

ax1 = plt.subplot(gs[0,:2])
ax1.set_ylabel('ylabel', labelpad = 0, fontsize = 12)

ax2 = plt.subplot(gs[0, 2:4])
ax2.set_ylabel('ylabel', labelpad = 0, fontsize = 12)

ax3 = plt.subplot(gs[0, 4:6])
ax3.set_ylabel('ylabel', labelpad = 0, fontsize = 12)

ax4 = plt.subplot(gs[1, 1:3])
ax4.set_ylabel('ylabel', labelpad = 0, fontsize = 12)

ax5 = plt.subplot(gs[1, 3:5])
ax5.set_ylabel('ylabel', labelpad = 0, fontsize = 12)

plt.show()
输出:
相关用法
- Python Matplotlib.ticker.MultipleLocator用法及代码示例
- Python Matplotlib.patches.CirclePolygon用法及代码示例
- Python Matplotlib.colors.Normalize用法及代码示例
- Python Matplotlib.colors.LogNorm用法及代码示例
注:本文由纯净天空筛选整理自RajuKumar19大神的英文原创作品 Matplotlib.gridspec.GridSpec Class in Python。非经特殊声明,原始代码版权归原作者所有,本译文未经允许或授权,请勿转载或复制。