Matplotlib是Python中令人惊叹的可视化库,用于数组的二维图。 Matplotlib是一个基于NumPy数组的多平台数据可视化库,旨在与更广泛的SciPy堆栈配合使用。
matplotlib.colors.Normalize
matplotlib.colors.Normalize类属于matplotlib.colors模块。 matplotlib.colors模块用于将颜色或数字参数转换为RGBA或RGB。此模块用于将数字映射到颜色或以一维颜色数组(也称为colormap)进行颜色规格转换。
matplotlib.colors.Normalize类用于将数据规范化为[0.0,1.0]的间隔。
用法:
class matplotlib.colors.Normalize(vmin=None, vmax=None, clip=False)
如果未设置vmin或vmax,则它将分别从处理的第一个输入的最小值和最大值进行初始化。换句话说,__call __(Data)调用autoscale_None(Data)。如果clip的值设置为True且给定值超出范围,则它将返回0或1,以最接近的值为准。如果vmax == vmin,则返回0。它与标量或包含掩码数组的数组一起运行。如果clip为True,则将蒙版值设置为1,否则它们将保持蒙版。
方法:
- autoscale(self, A):此方法将vmin设置为A的最小值,并将vmax设置为A的最大值。
- autoscale_None(self, A):此方法仅自动缩放具有无值的vmin和vmax。
- inverse(self, value):它交换vmin和vmax的值。
- static process_value(value):此方法中的value参数可以是标量或序列。它用于均化输入值,以进行有效而简单的标准化。此方法返回匹配值的掩码数组。将保留所有浮点数据类型,并将具有两个或更少字节的整数数据类型转换为np.float32,而将较大字节类型的数据转换为np.float64。这样做是为了通过使用就地操作尽可能保留float32值来提高大型数组的速度。
- scaled(self):它返回一个布尔值以检查是否设置了vmin或vmax。
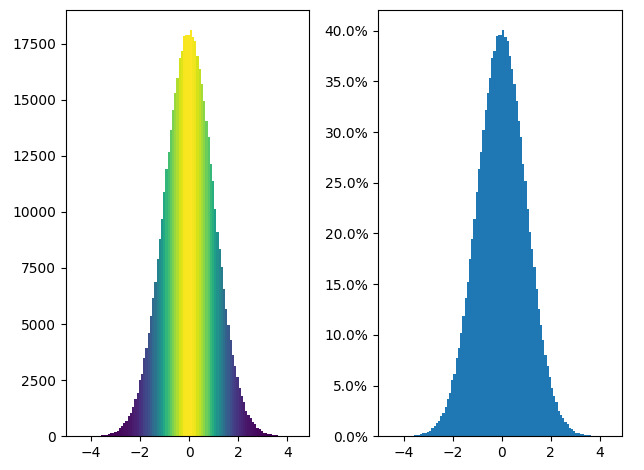
范例1:
import matplotlib.pyplot as plt
import numpy as np
from matplotlib import colors
from matplotlib.ticker import PercentFormatter

# set a  random state for
# reproducibility
np.random.seed(19687581)

total_points = 500000
total_bins = 100

# Centering at a = 0 and b = 5
# generate normal distributions
a = np.random.randn(total_points)
b = .4 * a + np.random.randn(500000) + 5

figure, axes = plt.subplots(1, 2,
                            tight_layout = True)

# C is the count in each bin
C, bins, patches = axes[0].hist(a,
                                bins = total_bins)

# We'll color code by height,
# but you could use any scalar
fracs = C / C.max()

# Normalize of  the data to 0..1
# for covering the full range of
# the colormap
norm = colors.Normalize(fracs.min(), fracs.max())

# looping through the objects and
# setting the color of each accordingly
for thisfrac, thispatch in zip(fracs, patches):
    color = plt.cm.viridis(norm(thisfrac))
    thispatch.set_facecolor(color)

# normalize the inputs by C
axes[1].hist(a, bins = total_bins, density = True)

# formating the y-axis for displaying
# percentage
axes[1].yaxis.set_major_formatter(PercentFormatter(xmax = 1))
输出:
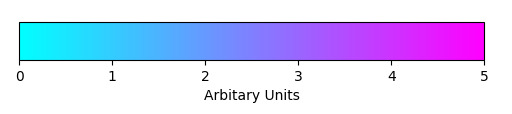
范例2:
import matplotlib.pyplot as plt
import matplotlib as mpl

figure, axes = plt.subplots(figsize =(6, 1))
figure.subplots_adjust(bottom = 0.5)

color_map = mpl.cm.cool
normlizer = mpl.colors.Normalize(vmin = 0, vmax = 5)

figure.colorbar(mpl.cm.ScalarMappable(norm = normlizer,
               cmap = color_map),
               cax = axes, orientation ='horizontal',
               label ='Arbitary Units')
输出:
相关用法
- Python Matplotlib.ticker.MultipleLocator用法及代码示例
- Python Matplotlib.gridspec.GridSpec用法及代码示例
- Python Matplotlib.patches.CirclePolygon用法及代码示例
- Python Matplotlib.colors.LogNorm用法及代码示例
注:本文由纯净天空筛选整理自RajuKumar19大神的英文原创作品 Matplotlib.colors.Normalize class in Python。非经特殊声明,原始代码版权归原作者所有,本译文未经允许或授权,请勿转载或复制。