Matplotlib是Python中令人惊叹的可视化库,用于数组的二维图。 Matplotlib是一个基于NumPy数组的多平台数据可视化库,旨在与更广泛的SciPy堆栈配合使用。
matplotlib.ticker.AutoLocator
这个 matplotlib.ticker.AutoLocator类是的子类 matplotlib.ticker.MaxNLocator,并且具有参数nbins = 'auto'和步骤= [1、2、2.5、5、10]。它用于动态查找主要tck位置。
用法:class matplotlib.ticker.AutoLocator
参数:
- nbins:它可以是整数或‘auto’,其中整数值表示最大间隔数。比最大刻度数少一。箱数是根据轴的长度自动确定的,它是一个可选参数,默认值为10。
- steps:它是一个可选参数,代表一个从1开始到10为止的整数序列。
- integer:它是一个可选的布尔值。如果设置为True,则刻度线仅接受整数值,前提是至少min_n_ticks个整数在视图范围内。
- symmetric:它是一个可选值。如果设置为True,则auto-scaling将导致范围对称于零。
- prune:它是一个可选参数,它接受以下四个值之一:{‘lower’, ‘upper’,‘both’,无}。默认情况下为“无”。
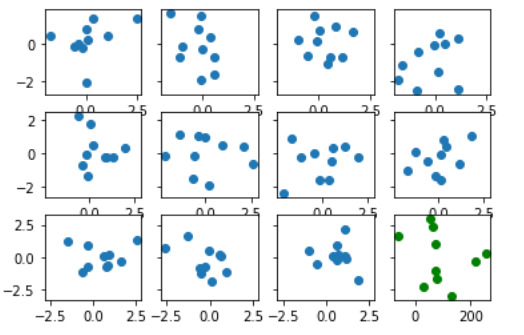
范例1:
import matplotlib
import matplotlib.pyplot as plt
import numpy as np


fig, axes = plt.subplots(3, 4,
                         sharex = 'row',
                         sharey = 'row',
                         squeeze = False)

data = np.random.rand(20, 2, 10)

for ax in axes.flatten()[:-1]:

    ax.plot(*np.random.randn(2, 10), marker ="o", ls ="")


# Now remove axes[1, 5] from
# the grouper for xaxis
axes[2, 3].get_shared_x_axes().remove(axes[2, 3])

# Create and assign new ticker
xticker = matplotlib.axis.Ticker()
axes[2, 3].xaxis.major = xticker

# The new ticker needs new locator
# and formatters
xloc = matplotlib.ticker.AutoLocator()
xfmt = matplotlib.ticker.ScalarFormatter()

axes[2, 3].xaxis.set_major_locator(xloc)
axes[2, 3].xaxis.set_major_formatter(xfmt)

# Now plot to the "ungrouped" axes
axes[2, 3].plot(np.random.randn(10)*100 + 100,
                np.linspace(-3, 3, 10),
                marker ="o", ls ="",
                color ="green")

plt.show()
输出:
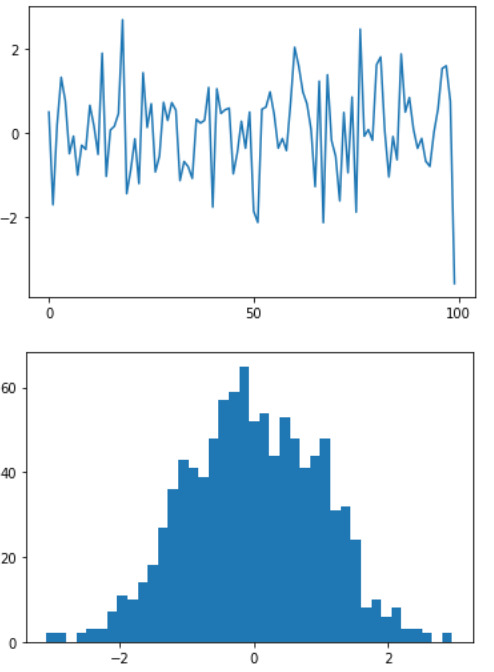
范例2:
import pylab as pl
from matplotlib import ticker


# helper function
def AutoLocatorInit(self):

    ticker.MaxNLocator.__init__(self,
                                nbins = 4,
                                steps =[1, 2, 5, 10])


ticker.AutoLocator.__init__ = AutoLocatorInit

pl.plot(pl.randn(100))
pl.figure()
pl.hist(pl.randn(1000), bins = 40)

pl.show()
输出:
相关用法
- Python Matplotlib.ticker.MultipleLocator用法及代码示例
- Python Matplotlib.gridspec.GridSpec用法及代码示例
- Python Matplotlib.patches.CirclePolygon用法及代码示例
- Python Matplotlib.colors.Normalize用法及代码示例
注:本文由纯净天空筛选整理自RajuKumar19大神的英文原创作品 Matplotlib.ticker.AutoLocator Class in Python。非经特殊声明,原始代码版权归原作者所有,本译文未经允许或授权,请勿转载或复制。