Matplotlib是Python中令人惊叹的可视化库,用于数组的二维图。 Matplotlib是一个基于NumPy数组的多平台数据可视化库,旨在与更广泛的SciPy堆栈配合使用。
Matplotlib.colors.TwoSlopeNorm
matplotlib.colors.TwoSlopeNorm类用于以设置的中心标准化数据。在概念中心周围以不相等的变化率映射数据时,它非常方便。例如,-3到6之间的范围的中心为0。
用法: class matplotlib.colors.TwoSlopeNorm(vcenter, vmin=None, vmax=None)
参数:
- vcenter:它具有一个浮点值,该值定义了标准化的0.5。
- vmin:这是一个可选参数,用于在规范化中定义数据值0.0。默认为数据集的最小值。
- vmax:这是一个可选参数,用于在规范化中定义数据值1.0。默认为数据集的最大值。
类的方法:
- autoscale_none(self, A):此方法用于通过获取vmax和vmin来裁剪vcenter。
范例1:
import numpy as np
import matplotlib.pyplot as plt
import matplotlib.cbook as cbook
import matplotlib.colors as colors
file = cbook.get_sample_data('topobathy.npz',
asfileobj = False)
with np.load(file) as example:
topo = example['topo']
longi = example['longitude']
latit = example['latitude']
figure, axes = plt.subplots(constrained_layout = True)
# creating a colormap that has land
# and ocean clearly delineated and
# of the same length (256 + 256)
undersea = plt.cm.terrain(np.linspace(0, 0.17, 256))
land = plt.cm.terrain(np.linspace(0.25, 1, 256))
every_colors = np.vstack((undersea, land))
terrain_map = colors.LinearSegmentedColormap.from_list('terrain_map',
every_colors)
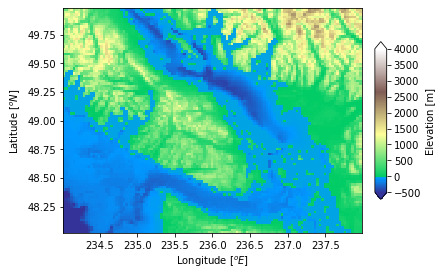
# the center is offset so that
# the land has more dynamic range
# while making the norm
diversity_norm = colors.TwoSlopeNorm(vmin =-500,
vcenter = 0,
vmax = 4000)
pcm = axes.pcolormesh(longi, latit, topo,
rasterized = True,
norm = diversity_norm,
cmap = terrain_map, )
axes.set_xlabel('Longitude $[^o E]$')
axes.set_ylabel('Latitude $[^o N]$')
axes.set_aspect(1 / np.cos(np.deg2rad(49)))
figure.colorbar(pcm, shrink = 0.6, extend ='both',
label ='Elevation [m]')
plt.show()输出:
范例2:
import numpy as np
import matplotlib.pyplot as plt
import matplotlib.colors as mcolors

data = np.random.normal(.4, 2, (10, 10))

two_slope_norm = mcolors.TwoSlopeNorm(vmin = data.min(),
                                      vmax = data.max(),
                                      vcenter = 0)

plt.imshow(data, cmap = plt.cm.RdBu,
           norm = two_slope_norm)

plt.colorbar()
plt.show()
输出:

相关用法
- Python Matplotlib.ticker.MultipleLocator用法及代码示例
- Python Matplotlib.gridspec.GridSpec用法及代码示例
- Python Matplotlib.patches.CirclePolygon用法及代码示例
- Python Matplotlib.colors.Normalize用法及代码示例
注:本文由纯净天空筛选整理自RajuKumar19大神的英文原创作品 Matplotlib.colors.TwoSlopeNorm class in Python。非经特殊声明,原始代码版权归原作者所有,本译文未经允许或授权,请勿转载或复制。