
本文以数据及代码示例讲解Pandas和Matplotlib的基本用法,主要内容分为以下几节:
基本要求
- 从CSV读取数据
- 格式化,清理和过滤数据框
- Group-by和合并
可视化数据
- Plot函数基础
- Seaborn 小提琴图和lm-plots
- 配对图和热力图
图美学
- 多轴绘图
- 使图表看起来更美观[艺术]
如果你想学习如何进行数据绘图或者数据可视化,本文将对您有所帮助。
基本要求
读取CSV ,需要导入Matplotlib和Pandas
import matplotlib.pyplot as plt
import pandas as pd
import numpy as np
%matplotlib inline
car_data = pd.read_csv('inbox/CarData-E-class-Tue Jul 03 2018.csv')Inline(内联)表示将图显示为单元格输出(jupyter notebook单元格,而不是单独窗口),read_csv返回一个DataFrame,文件路径相对于notebook跟目录而言。
格式化,清理和过滤数据(DataFrame)
通常,在处理大量特征列时,最好能看一下第一行或所有列的名称,这可使用colums属性和head(n行)功能。但是,如果我们对诸如modelLine这样的类别的值感兴趣,则可以使用方括号语法访问列,并使用 .unique() 检查选项。
print(car_data.columns)
car_data.head(2)
car_data['modelLine'].unique()
我们将使用正则表达式将所有包含SE的东西替换为特殊设备。同时,有一些列含Nans(不是数字),可以用dropna(subset = [‘modelLine’])去掉modelLine列中值为Nans行。
car_data = car_data.dropna(subset=['modelLine'])
car_data['modelLine'] = car_data['modelLine'].replace(to_replace={'.*SE.*': 'Standard equipment'}, regex=True)
我们还可以通过将modelLine的行与某个布尔问题进行比较来过滤掉不需要的值,例如“ undefined”。
car_data = car_data[(car_data['modelLine'] != 'undefined')]
car_data['modelLine'].unique()![]()
注意上面的 Pandas 是如何从不改变任何现有数据的,因此当我们执行任何改变/过滤器时,我们必须手动覆盖旧数据。尽管这比较费事,但它是一种有效的减少代码有害副作用和错误的方法。
接下来,我们还需要更改firstRegistration字段,通常应将其视为python日期格式,但是为了方便以后在文章中对数据进行回归建模,我们将其视为数字字段。
考虑到这些数据与汽车登记相关,因此,年份确实是我们需要保留的重要组成部分。因此,将其视为数字字段意味着我们可以应用数字舍入、乘法/除法来创建“注册年”功能列,如下所示。
car_data['firstRegistration'].head(5)
car_data[‘firstRegistrationYear’] = round((car_data[‘firstRegistration’] / 10000),0)
car_data[‘firstRegistrationYear’] .head(5)
使用Group-by和合并
Group-by可用于根据数据集中的特征列构建行组,以 “ modelLine”类别列。然后,我们可以对各个组执行诸如均值,最小值,最大值,标准差之类的运算,以帮助描述样本数据。
group_by_modelLine = car_data.groupby(by=['modelLine'])
car_data_avg = group_by_modelLine.mean()
car_data_count = group_by_modelLine.count()

如您所见,已经为每个Model Line计算了每个数字特征的平均值。Group By具有高度的通用性,并且还接受lambda函数以实现更复杂的行/分组标记。
接下来,我们将组装仅包含相关特征列的DataFrame,以绘制可用性(也就是汽车数量)和每辆汽车平均装备的图表。可以通过传入关键字字典来创建此DataFrame,这些关键字代表来自我们现有数据的单列或系列的列和值。或者,我们可以通过两个DataFrame的索引(modelLine)合并它们,并适当地重命名重复列的后缀。
然后,我们将绘制这两个变量,按设备排序,然后将可用性绘制为水平条形图。
# Since all the columns in car_data_count are the same, we will use just the first column as the rest yield the same result. iloc allows us to take all the rows and the zeroth column.
car_data_count_series = car_data_count.iloc[:,0]
features_of_interest = pd.DataFrame({'equipment': car_data_avg['equipment'], 'availability': car_data_count_series})
alternative_method = car_data_avg.merge(car_data_count, left_index=True, right_index=True, suffixes=['_avg','_count'])
alternative_method[['equipment_avg', 'firstRegistration_count']].sort_values(by=['equipment_avg', 'firstRegistration_count'], ascending=True).plot(kind='barh')
可视化数据
Pandas Plot函数
Pandas具有内置的.plot()函数作为DataFrame类的一部分。它具有几个关键参数:
kind—绘图类型,可以在文档中找到的“ bar”,“ barh”,“ pie”,“ scatter”,“ kde”等。
color—颜色,接受和对应于每个数据系列/列的十六进制代码数组。
linestyle—线条形状,“实心”,“虚线”,“虚线”(仅适用于折线图)
xlim,ylim—指定要为其绘制图的元组(下限,上限)
legend—用于显示或隐藏图例的布尔值
labels—与数据框中的列数相对应的列表,可以在此处为图例提供描述性名称
title—plot的字符串标题
这些都比较容易使用,我们将在后面的文章中使用.plot()给出一些示例。
Seaborn lmplots
Seaborn建立在matplotlib之上,以提供更丰富的现成环境。它包括一个整洁的lmplot绘图函数,用于快速探索多个变量。使用我们的汽车数据示例,我们想了解汽车的设备kit-out与售价之间的关联。首先,导入seaborn:
import seaborn as sns为设备和价格(x和y轴)的输入列标签,然后输入实际的DataFrame来源。使用col关键字为Model Line生成一个单独的图,并将col_wrap 2设置为一个漂亮的网格。
filtered_class = car_data[car_data['modelLine'] != 'AVANTGARDE']
sns.lmplot("equipment", "price", data=filtered_class, hue="gears", fit_reg=False, col='modelLine', col_wrap=2)
如您所见,我们用3行代码即可对数据集进行快速分析。
Seaborn小提琴图
这些图非常适合处理大型连续数据集,并且可以类似地通过索引进行细分。使用我们的汽车数据集,我们可以对二手车的价格分布有更深入的了解。由于汽车的寿命会显著影响价格,因此我们将第一个注册年份作为x轴变量,将价格作为y。然后,我们可以设置颜色以区分各种模型变体。
from matplotlib.ticker import AutoMinorLocator
fig = plt.figure(figsize=(18,6))
LOOKBACK_YEARS = 3
REGISTRATION_YEAR = 2017
filtered_years = car_data[car_data['firstRegistrationYear'] > REGISTRATION_YEAR - LOOKBACK_YEARS]
ax1 = sns.violinplot('firstRegistrationYear', "price", data=filtered_years, hue='modelLine')
ax1.minorticks_on()
ax1.xaxis.set_minor_locator(AutoMinorLocator(2))
ax1.grid(which='minor', axis='x', linewidth=1)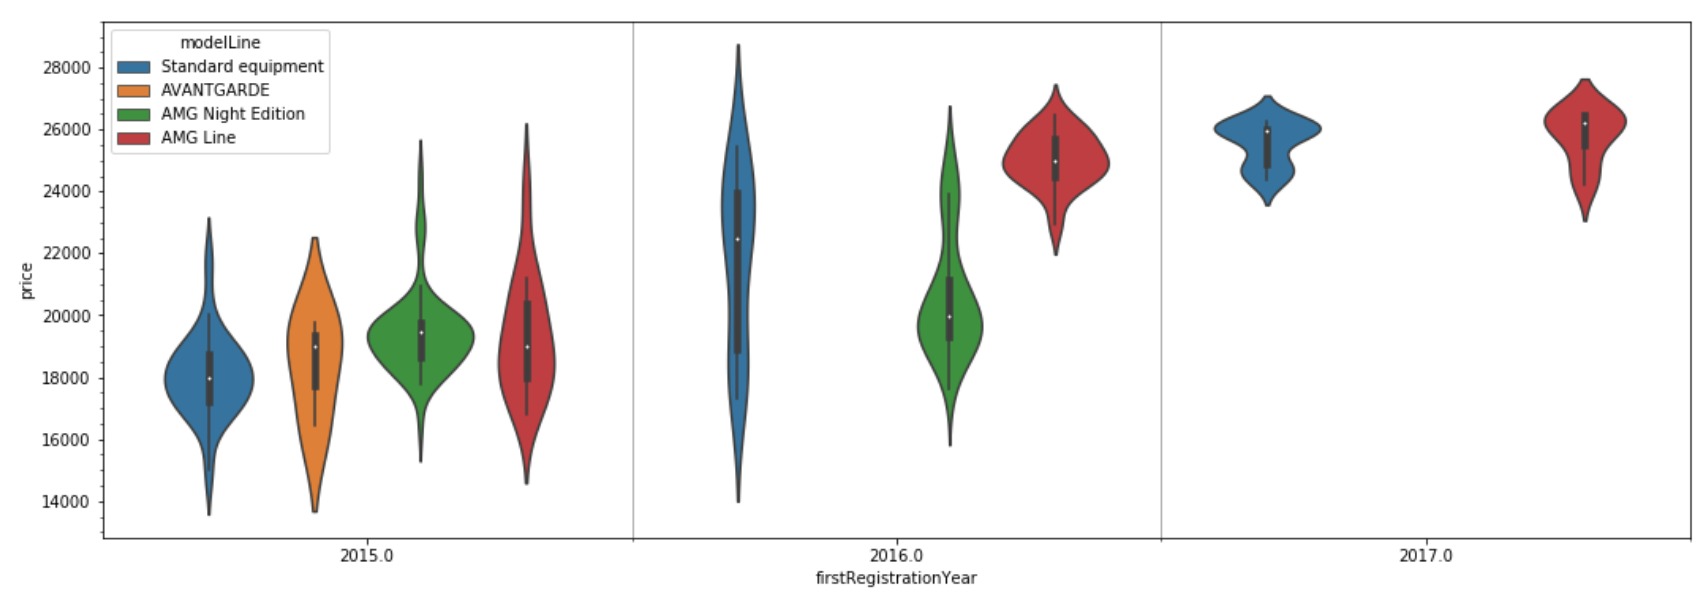
请注意,小提琴绘图函数会返回图中的坐标轴。这使我们可以编辑轴的属性。在这种情况下,我们已设置次要刻度线,并使用AutoMinorLocator在每个主要间隔之间放置1个次要刻度线。
配对图相关性热力图
在具有少量特征(10–15)的数据集中,Seaborn Pairplots可以快速实现对变量之间任何关系的直观检查。沿左对角线的图形表示每个要素的分布,而对角线之外的图形则显示变量之间的关系。
sns.pairplot(car_data.loc[:,car_data.dtypes == 'float64'])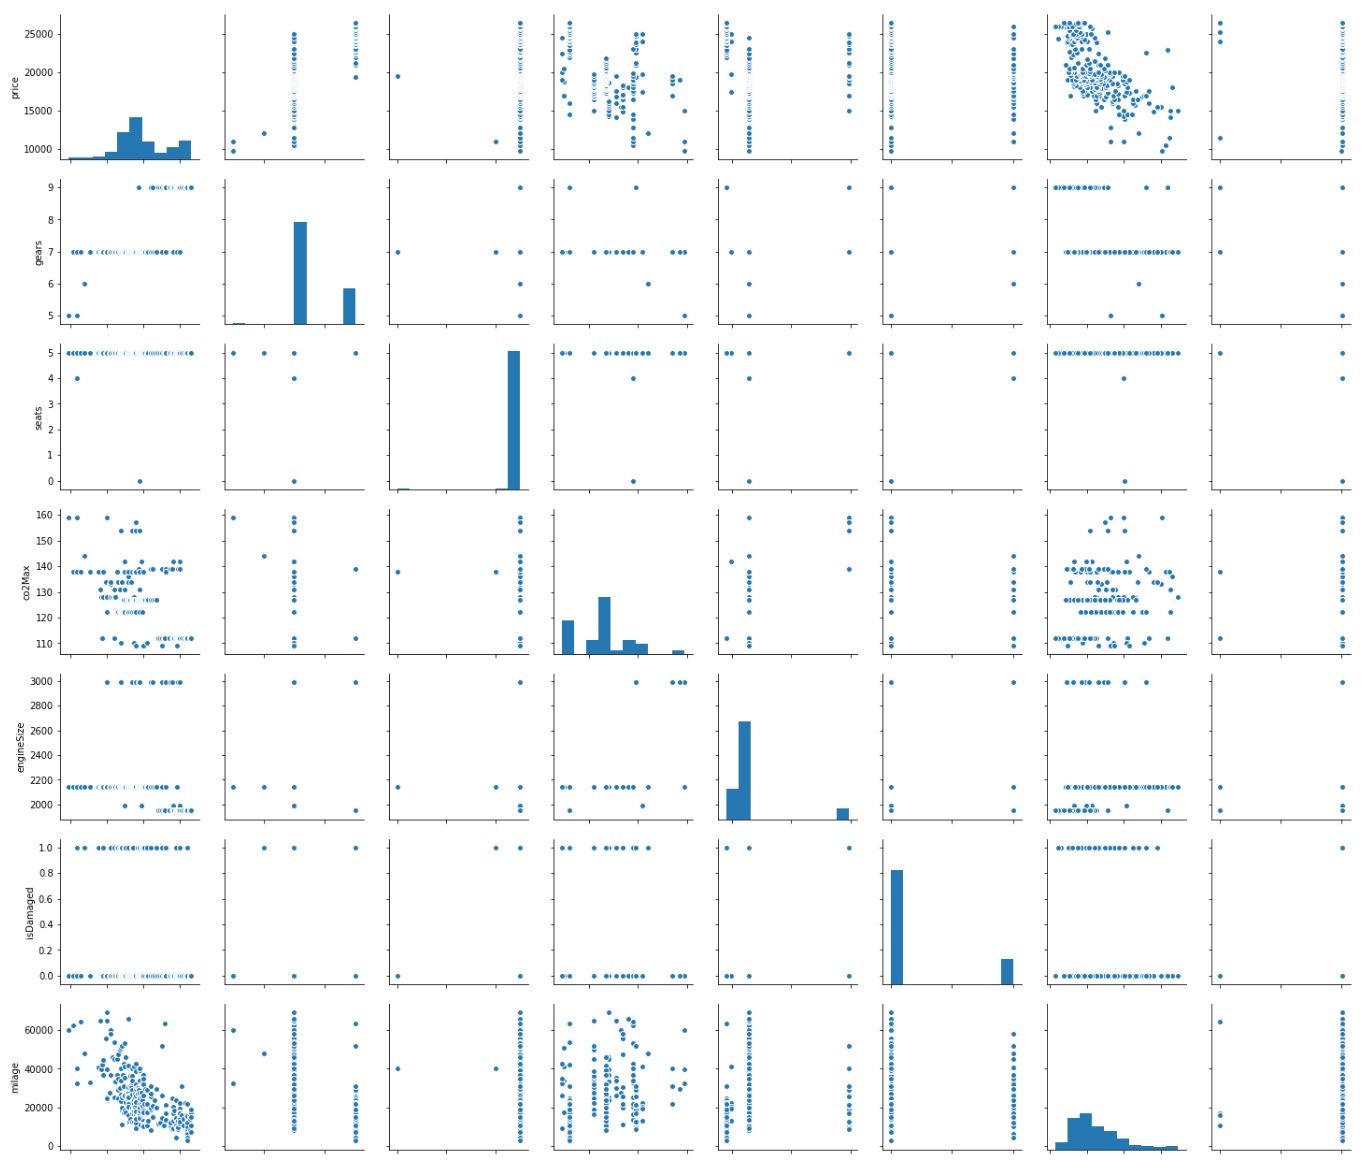
同样,我们可以利用pandas Corr()查找矩阵中每个变量之间的相关性,并使用Seaborn的Heatmap函数(指定标签和Heatmap颜色范围)进行绘制。
corr = car_data.loc[:,car_data.dtypes == 'float64'].corr()
sns.heatmap(corr, xticklabels=corr.columns, yticklabels=corr.columns, cmap=sns.diverging_palette(220, 10, as_cmap=True))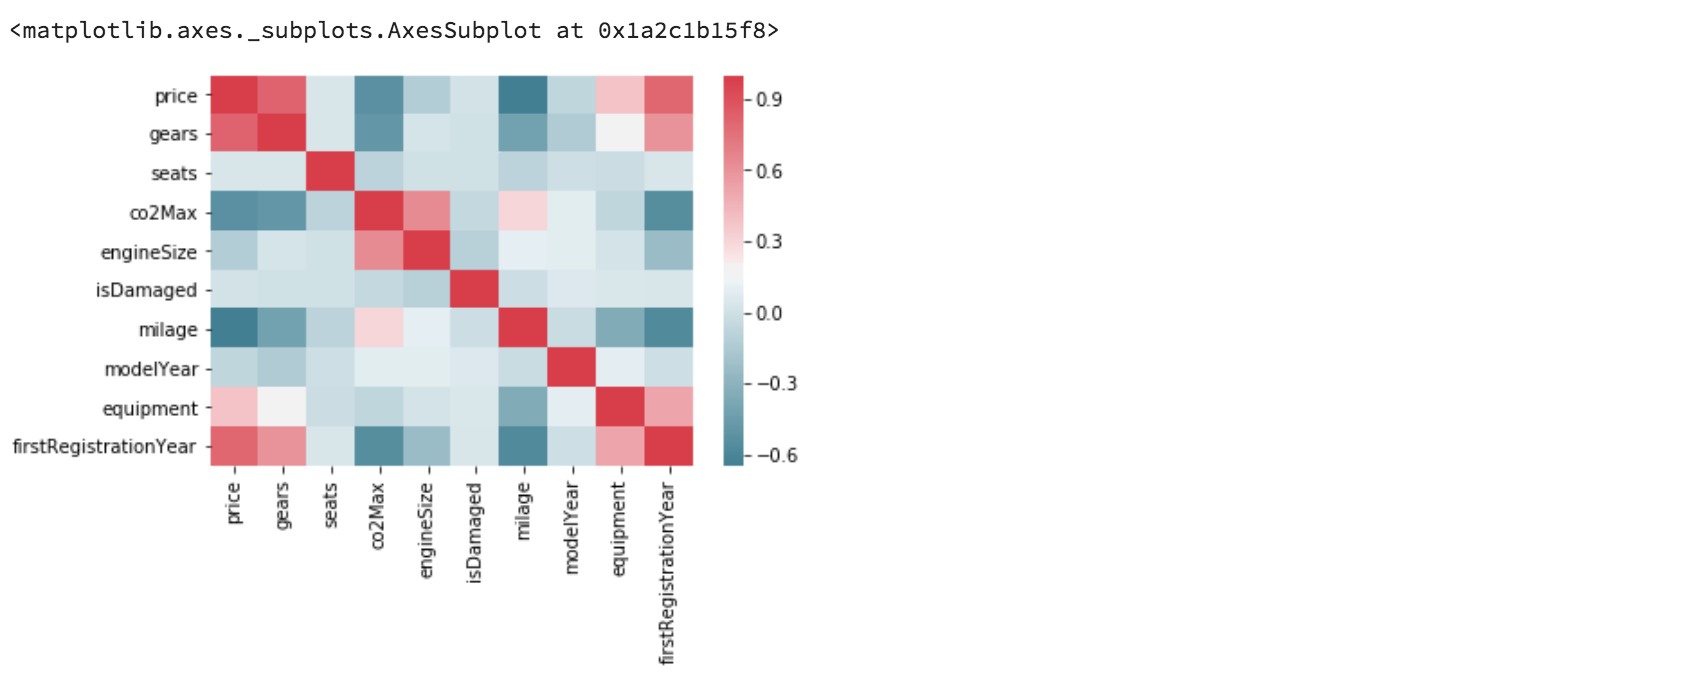
结合使用这两个工具对于快速识别模型的重要特征非常有用。例如,使用热力图,我们可以从第一行看到齿轮的数量和首次注册与价格成正相关,而里程数则可能与价格成负相关。
图美学
多轴绘图
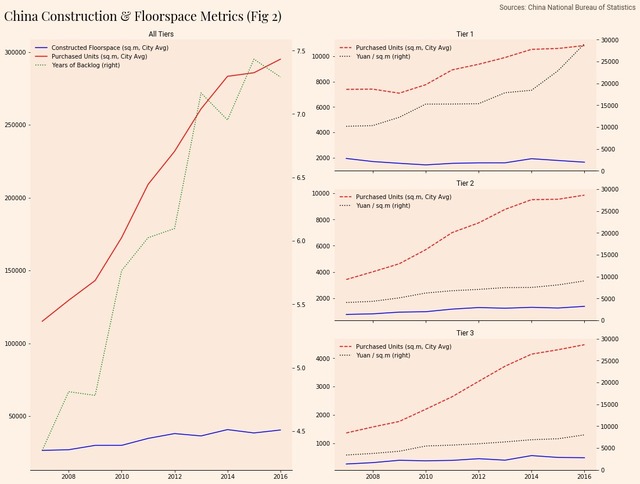
以下是我之前关于中国房地产泡沫的文章中的一些数据。我想显示所有城市的建设数据,然后在一个图中按城市级别提供后续细分。
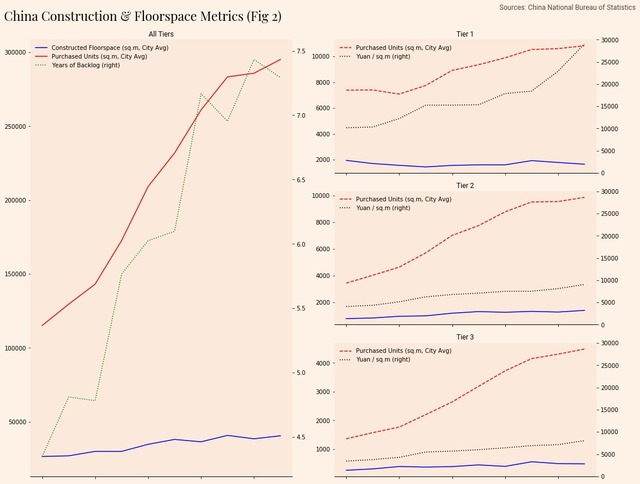
让我们细分一下如何创建这样的图:
首先,我们定义图形的大小以提供足够的绘图空间。使用多轴绘图时,我们定义了可以放置轴的网格。然后,我们使用subplot2grid函数返回期望位置的坐标轴。
fig = plt.figure(figsize = (15,12))
grid_size = (3,2)
hosts_to_fmt = [] # Place A Title On The Figure
fig.text(x=0.8, y=0.95, s='Sources: China National Bureau of Statistics',fontproperties=subtitle_font, horizontalalignment='left',color='#524939')
# Overlay multiple plots onto the same axis, which spans 1 entire column of the figure
large_left_ax = plt.subplot2grid(grid_size, (0,0), colspan=1, rowspan=3)
然后,我们可以通过指定plot函数的ax属性来绘制到该轴上。请注意,尽管在特定轴上进行了绘制,但使用secondary_y参数意味着将创建一个新的轴实例。这对于以后存储格式很重要。
# Aggregating to series into single data frame for ease of plotting
construction_statistics = pd.DataFrame({
    'Constructed Floorspace (sq.m, City Avg)':
     china_constructed_units_total,
    'Purchased Units (sq.m, City Avg)':
     china_under_construction_units_total,
})
construction_statistics.plot(ax=large_left_ax,
    legend=True, color=['b', 'r'], title='All Tiers')
# Second graph overlayed on the secondary y axis
large_left_ax_secondary = china_years_to_construct_existing_pipeline.plot(
    ax=large_left_ax, label='Years of Backlog', linestyle='dotted',
    legend=True, secondary_y=True, color='g')
# Adds the axis for formatting later
hosts_to_fmt.extend([large_left_ax, large_left_ax_secondary])
要按城市层划分细分,我们再次使用subplot2grid,但这一次更改每个循环的索引,这样3层图表就在另一个图表的下方绘制。
# For each City Tier overlay a series of graphs on an axis on the right hand column
# Its row position determined by its index
for index, tier in enumerate(draw_tiers[0:3]):
    tier_axis = plt.subplot2grid(grid_size, (index,1))
china_constructed_units_tiered[tier].plot(ax=tier_axis,
title=tier, color=’b’, legend=False)
ax1 = china_under_construction_units_tiered[tier].plot(
ax=tier_axis,linestyle=’dashed’, label=’Purchased Units
(sq.m,City Avg)’, title=tier, legend=True, color=’r’)
ax2 =china_property_price_sqmetre_cities_tiered[tier].plot(
ax=tier_axis, linestyle=’dotted’, label=’Yuan / sq.m’,
secondary_y=True, legend=True, color=’black’)
ax2.set_ylim(0,30000)
hosts_to_fmt.extend([ax1,ax2])
好了,现在我们已经生成了正确的布局并绘制了数据:

让您的图表看起来更美观
在上面的图表中,我选择了类似ft.com的样式。首先,我们需要通过Matplotlib字体管理器导入字体,并为每个类别创建一个字体属性对象。
import matplotlib.font_manager as fm# Font Imports
heading_font = fm.FontProperties(fname='/Users/hugo/Desktop/Playfair_Display/PlayfairDisplay-Regular.ttf', size=22)
subtitle_font = fm.FontProperties(
fname='/Users/hugo/Library/Fonts/Roboto-Regular.ttf', size=12) # Color Themes
color_bg = '#FEF1E5'
lighter_highlight = '#FAE6E1'
darker_highlight = '#FBEADC'
接下来,我们将定义一个函数,该函数将:
- 设置图形背景(使用set_facecolor)
- 使用指定的标题字体将标题应用于图形。
- 调用布局紧凑函数可以更紧凑地利用绘图空间。
接下来,我们将遍历图中的每个轴,并调用以下函数:
- 禁用除底部刺(轴边界)以外的所有刺
- 将轴的背景色设置为略深。
- 如果存在legend,请禁用legend周围的白框。
- 设置每个轴的标题以使用副标题字体。
最后,我们只需要调用我们创建的formatter函数,并传入我们的图形和之前收集的轴即可。
结论
感谢您阅读本教程,希望它能帮助您入门并使用Pandas和Matplotlib。
