Seaborn是基於Matplotlib的Python數據可視化庫。它提供了一個高級接口,用於繪製引人入勝且內容豐富的統計圖形。 well-designed可視化隻是一些非凡的東西。顏色脫穎而出,各層完美地融合在一起,輪廓遍及整個流程,整個包裝不僅具有良好的美學品質,而且還為我們提供了有意義的見解。
seaborn.barplot()方法
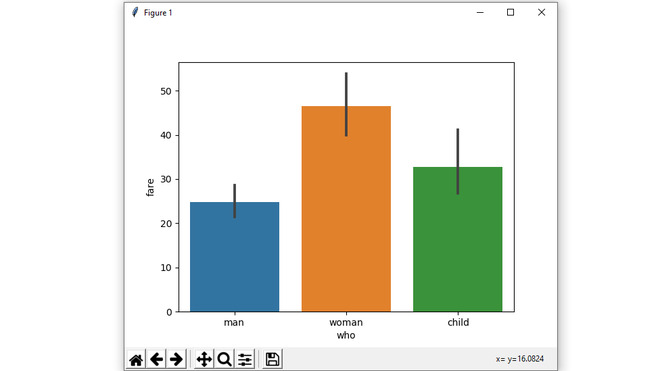
條形圖通常用於根據某些方法匯總分類數據,默認情況下,它是平均值。也可以理解為按行動分組的可視化。要使用此圖,我們為x軸選擇一個分類列,為y軸選擇一個數值列,並且我們看到它創建了一個以每個分類列取平均值的圖。
用法:seaborn.barplot(x=None, y=None, hue=None, data=None, order=None, hue_order=None, estimator=<function mean at 0x000002BC3EB5C4C8>, ci=95, n_boot=1000, units=None, orient=None, color=None, palette=None, saturation=0.75, errcolor=’.26′, errwidth=None, capsize=None, dodge=True, ax=None, **kwargs,)
參數:
| 參數 | 值 | 描述 |
|---|---|---|
| x, y, hue | “數據”或矢量數據中的變量名稱,可選 | 用於繪製long-form數據的輸入。請參見示例以獲取解釋。 |
| data | DataFrame,數組或數組列表,可選 | 繪圖數據集。如果不存在“ x”和“ y”,則將其解釋為wide-form。否則,預期為long-form。 |
| order, hue_order | 字符串列表,可選 | 為了繪製分類級別,否則從數據對象推斷級別。 |
| estimator | 可調用的映射向量->標量,可選 | 統計函數,用於估計每個分類箱中。 |
| ci | 浮點數或“sd”或無,可選 | 置信區間的大小,可用於估計值附近。如果為“sd”,請跳過引導程序並繪製觀測值的標準偏差。如果為“ None”,將不執行引導,並且不會繪製錯誤條。 |
| n_boot | int,可選 | 計算置信區間時要使用的引導程序迭代次數。 |
| units | “數據”或矢量數據中的變量名稱,可選 | 采樣單位的標識符,將用於執行多級引導程序並考慮重複測量的設計。 |
| orient | “v” | “h”,可選 | 繪圖的方向(垂直或水平)。這通常是根據輸入變量的dtype推論得出的,但可用於指定“categorical”變量是數字變量還是繪製wide-form數據時。 |
| color | matplotlib顏色,可選 | 所有元素的顏色,或漸變調色板的種子。 |
| palette | 調色板名稱,列表或字典,可選 | 用於“ hue”變量的不同級別的顏色。應該是可由color_palette函數解釋的東西,或者是將色相級別映射到matplotlib顏色的字典。 |
| saturation | 浮點數,可選 | 原始飽和度的繪製顏色比例。大色塊通常看起來略帶不飽和色,但看起來更好,但是如果您希望繪圖顏色與輸入顏色規格完全匹配,請將其設置為“ 1”。 |
| errcolor | matplotlib顏色 | 代表置信區間的線條顏色。 |
| errwidth | 浮點數,可選 | 誤差線(和頂蓋)的粗細。 |
| capsize | 浮點數,可選 | “caps”在誤差條上的寬度。 |
| dodge | 布爾值,可選 | 使用色相嵌套時,是否應沿分類軸移動元素。 |
| ax | matplotlib軸,可選 | 軸對象以繪製繪圖,否則使用當前軸。 |
| kwargs | 值映射 | 其他關鍵字參數在繪製時傳遞到“ plt.bar”。 |
使用以下步驟:
- 導入Seaborn
- 從Seaborn加載數據集,因為它包含良好的數據集。
- 使用seaborn.barplot()方法繪製條形圖。
下麵是實現:
範例1:
Python3
# importing the required library
import seaborn as sns
import matplotlib.pyplot as plt

# read a titanic.csv file
# from seaborn libraray
df = sns.load_dataset('titanic')

# who v/s fare barplot
sns.barplot(x = 'who',
            y = 'fare',
            data = df)

# Show the plot
plt.show()
輸出:

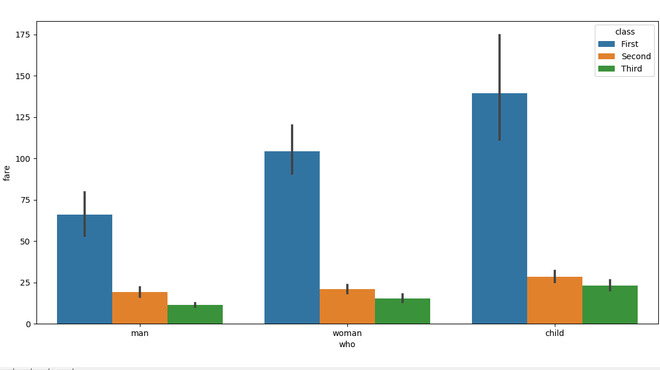
範例2:
Python3
# importing the required library
import seaborn as sns
import matplotlib.pyplot as plt

# read a titanic.csv file
# from seaborn libraray
df = sns.load_dataset('titanic')


# who v/s fare barplot
sns.barplot(x = 'who',
            y = 'fare',
            hue = 'class',
            data = df)

# Show the plot
plt.show()
輸出:

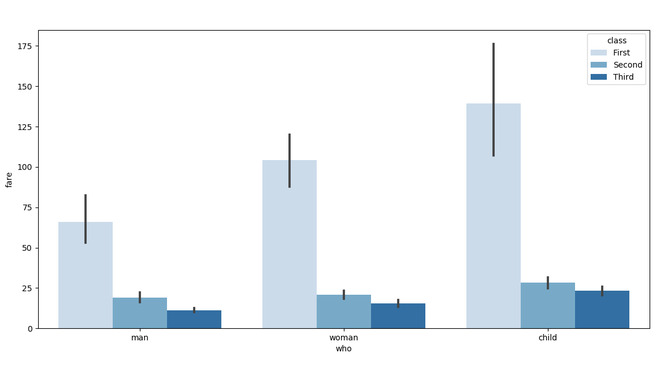
範例3:
Python3
# importing the required library
import seaborn as sns
import matplotlib.pyplot as plt

# read a titanic.csv file
# from seaborn libraray
df = sns.load_dataset('titanic')


# who v/s fare barplot
sns.barplot(x = 'who',
            y = 'fare',
            hue = 'class',
            data = df,
            palette = "Blues")

# Show the plot
plt.show()
輸出:

範例4:
Python3
# importing the required library
import seaborn as sns
import matplotlib.pyplot as plt
import numpy as np

# read a titanic.csv file
# from seaborn libraray
df = sns.load_dataset('titanic')


# who v/s fare barplot
sns.barplot(x = 'who',
            y = 'fare',
            hue = 'class',
            data = df,
            estimator = np.median,
            ci = 0)

# Show the plot
plt.show()
輸出:

相關用法
- Python os._exit()用法及代碼示例
- Python os.WEXITSTATUS()用法及代碼示例
- Python os.abort()用法及代碼示例
- Python os.renames()用法及代碼示例
- Python os.lseek()用法及代碼示例
- Python PyTorch sin()用法及代碼示例
- Python Sympy Line.is_parallel()用法及代碼示例
- Python PIL GaussianBlur()用法及代碼示例
- Python Numpy np.hermefit()用法及代碼示例
- Python Numpy np.hermevander()用法及代碼示例
- Python Method和Function的區別用法及代碼示例
- Python TextBlob.word_counts()用法及代碼示例
- Python sympy.GreaterThan()用法及代碼示例
- Python sympy.StrictLessThan()用法及代碼示例
- Python sympy.LessThan()用法及代碼示例
- Python sympy.StrictGreaterThan()用法及代碼示例
注:本文由純淨天空篩選整理自deepanshu_rustagi大神的英文原創作品 Seaborn.barplot() method in Python。非經特殊聲明,原始代碼版權歸原作者所有,本譯文未經允許或授權,請勿轉載或複製。
