先決條件:Seaborn編程基礎
Seaborn是基於matplotlib的Python數據可視化庫。它提供了一個高級接口,用於繪製引人入勝且內容豐富的統計圖形。 Seaborn幫助解決Matplotlib麵臨的兩個主要問題。問題是什麽?
- 默認Matplotlib參數
- 使用 DataFrame
隨著Seaborn對Matplotlib的補充和擴展,學習曲線是漸進的。如果您了解Matplotlib,那麽您已經走到了Seaborn的一半。
seaborn.PairGrid():
- 子圖網格,用於在數據集中繪製成對關係。
- 此類將數據集中的每個變量映射到多軸網格中的列和行。可以使用不同的axes-level繪圖函數在上三角形和下三角形中繪製雙變量圖,並且每個變量的邊際分布可以顯示在對角線上。
- 它還可以使用hue參數表示條件化的附加級別,該參數以不同的顏色繪製不同的數據子集。這使用顏色來解析第三維上的元素,但僅在彼此之上繪製子集,而不會像axes-level函數接受色相那樣為特定的可視化效果定製色相參數。
seaborn.PairGrid( data, \*\*kwargs)
Seaborn.PairGrid使用許多參數作為輸入,下麵以表的形式描述了其中的主要參數:
| 參數 | 描述 | Value |
| data | 整潔(long-form)數據幀,其中每一列都是變量,每一行都是觀察值。 | DataFrame |
| hue | 在“數據”中可變以將繪圖方麵映射到不同的顏色。 | 字符串(變量名),可選 |
| palette | 映射“ hue”變量的顏色集。如果是字典,則鍵應為“色相”變量中的值。 | dict或seaborn調色板 |
| vars | 要使用的“數據”中的變量,否則使用具有數字數據類型的每一列。 | 變量名列表,可選 |
| dropna | 繪製之前從數據中刪除缺失值。 | 布爾值,可選 |
下麵是上述方法的實現:
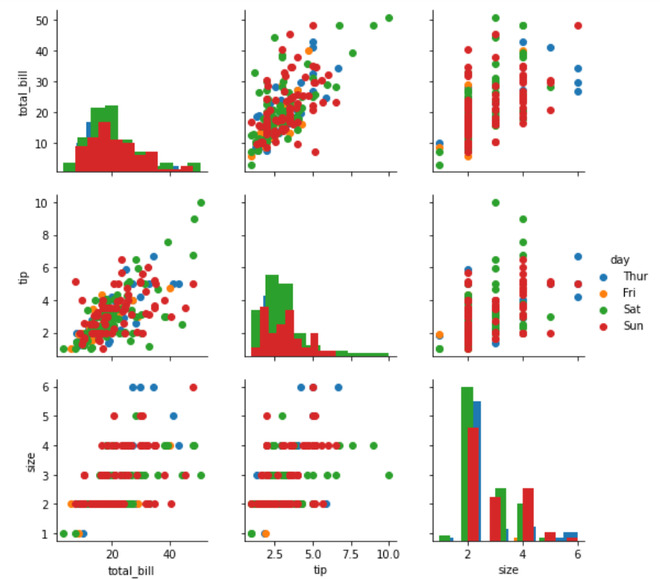
範例1:
Python3
# importing packages
import seaborn
import matplotlib.pyplot as plt

# loading dataset
df = seaborn.load_dataset('tips')

# PairGrid object with hue
graph = seaborn.PairGrid(df, hue ='day')
# type of graph for diagonal
graph = graph.map_diag(plt.hist)
# type of graph for non-diagonal
graph = graph.map_offdiag(plt.scatter)
# to add legends
graph = graph.add_legend()
# to show
plt.show()
# This code is contributed by Deepanshu Rusatgi.
輸出:

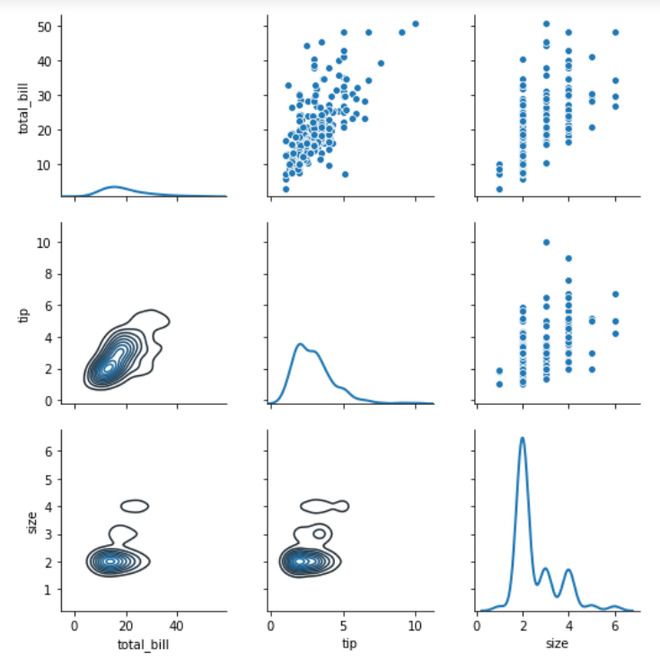
範例2:
Python3
# importing packages
import seaborn
import matplotlib.pyplot as plt

# loading dataset
df = seaborn.load_dataset('tips')

# PairGrid object with hue
graph = seaborn.PairGrid(df)
# type of graph for non-diagonal(upper part)
graph = graph.map_upper(sns.scatterplot)
# type of graph for non-diagonal(lower part)
graph = graph.map_lower(sns.kdeplot)
# type of graph for diagonal
graph = graph.map_diag(sns.kdeplot, lw = 2)
# to show
plt.show()
# This code is contributed by Deepanshu Rusatgi.
輸出:

相關用法
- Python os._exit()用法及代碼示例
- Python os.WEXITSTATUS()用法及代碼示例
- Python os.abort()用法及代碼示例
- Python os.renames()用法及代碼示例
- Python os.lseek()用法及代碼示例
- Python PyTorch sin()用法及代碼示例
- Python Sympy Line.is_parallel()用法及代碼示例
- Python PIL GaussianBlur()用法及代碼示例
- Python Numpy np.hermefit()用法及代碼示例
- Python Numpy np.hermevander()用法及代碼示例
- Python Method和Function的區別用法及代碼示例
- Python TextBlob.word_counts()用法及代碼示例
- Python sympy.GreaterThan()用法及代碼示例
- Python sympy.StrictLessThan()用法及代碼示例
- Python sympy.LessThan()用法及代碼示例
- Python sympy.StrictGreaterThan()用法及代碼示例
注:本文由純淨天空篩選整理自deepanshu_rustagi大神的英文原創作品 Python – seaborn.PairGrid() method。非經特殊聲明,原始代碼版權歸原作者所有,本譯文未經允許或授權,請勿轉載或複製。
