Seaborn是基於matplotlib的Python數據可視化庫。它提供了一個高級接口,用於繪製引人入勝且內容豐富的統計圖形。 Seaborn幫助解決Matplotlib麵臨的兩個主要問題。問題是什麽?
- 默認Matplotlib參數
- 使用 DataFrame
隨著Seaborn對Matplotlib的補充和擴展,學習曲線是漸進的。如果您知道Matplotlib,那麽您通過Seaborn已經是half-way。
seaborn.jointplot():
用雙變量和單變量圖繪製兩個變量的圖。此函數提供了一個方便的接口,可用於“ JointGrid”類,其中包含幾種固定的繪圖類型。這旨在成為一個相當輕巧的包裝器;如果您需要更大的靈活性,則應直接使用:class:“ JointGrid”。
用法: seaborn.jointplot(x, y, data=None, kind=’scatter’, stat_func=None, color=None, height=6, ratio=5, space=0.2, dropna=True, xlim=None, ylim=None, joint_kws=None, marginal_kws=None, annot_kws=None, **kwargs)
參數:以下是一些主要參數的說明:
x,y:這些參數采用數據或“data”中的變量名稱。
data:(可選)當“x”和“y”是變量名時,此參數采用DataFrame。
kind:(可選)此參數采用繪圖類型。
color:(可選)此參數采用Color用作圖元素。
dropna:(可選)此參數為布爾值,如果為True,則刪除“x”和“y”中缺少的觀測值。
返回:帶有網格圖的聯合網格對象。
下麵是上述方法的實現:
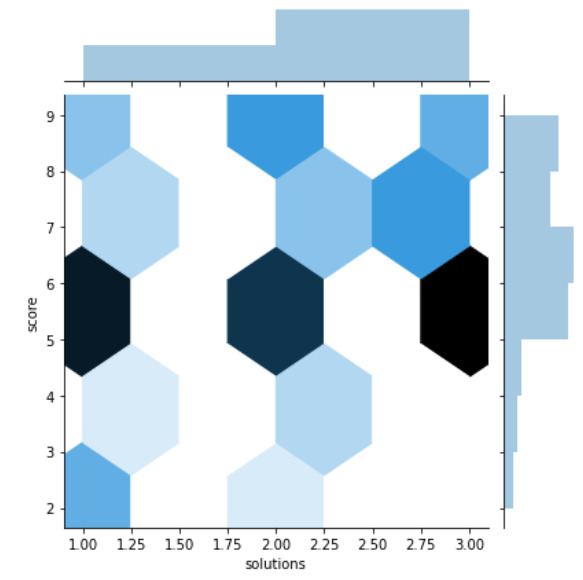
範例1:
Python3
# importing required packages
import seaborn as sns
import matplotlib.pyplot as plt

# loading dataset
data = sns.load_dataset("attention")

# draw jointplot with
# hex kind
sns.jointplot(x = "solutions", y = "score",
              kind = "hex", data = data)
# show the plot
plt.show()

# This code is contributed
# by Deepanshu Rustagi.
輸出:

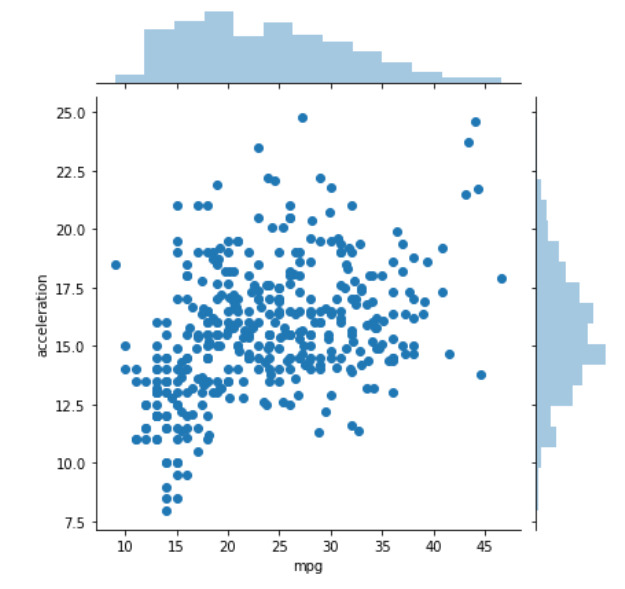
範例2:
Python3
# importing required packages
import seaborn as sns
import matplotlib.pyplot as plt

# loading dataset
data = sns.load_dataset("mpg")

# draw jointplot with
# scatter kind
sns.jointplot(x = "mpg", y = "acceleration",
              kind = "scatter", data = data)
# show the plot
plt.show()

# This code is contributed
# by Deepanshu Rustagi.
輸出:

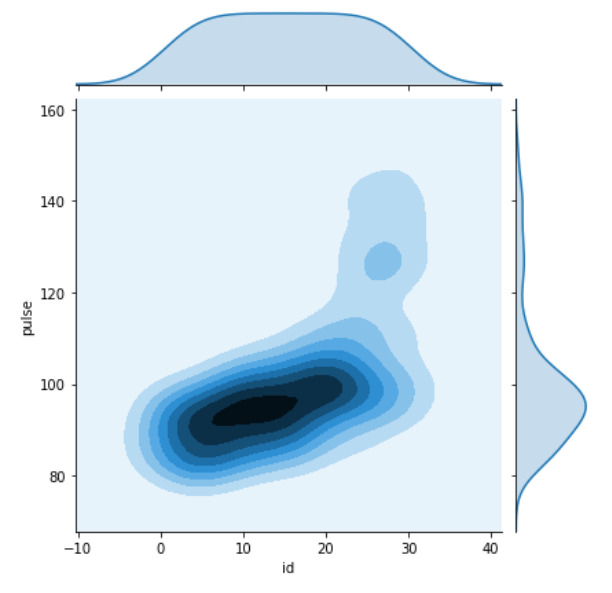
範例3:
Python3
# importing required packages
import seaborn as sns
import matplotlib.pyplot as plt

# loading dataset
data = sns.load_dataset("exercise")

# draw jointplot with
# kde kind
sns.jointplot(x = "id", y = "pulse",
              kind = "kde", data = data)
# Show the plot
plt.show()

# This code is contributed
# by Deepanshu Rustagi.
輸出:

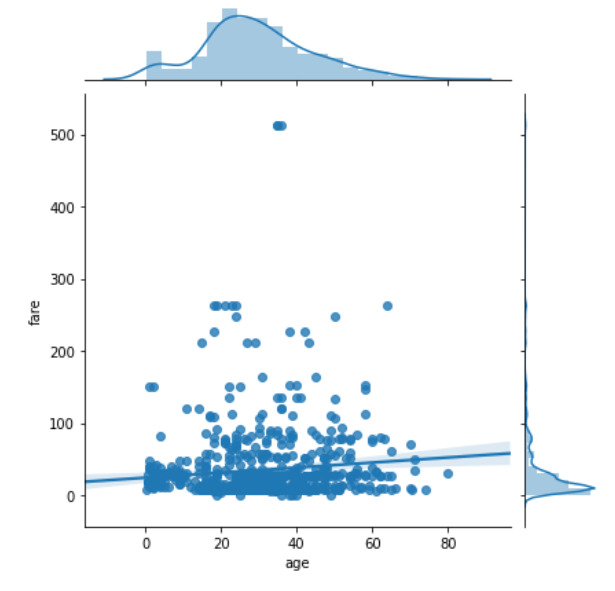
範例4:
Python3
# importing required packages
import seaborn as sns
import matplotlib.pyplot as plt

# loading dataset
data = sns.load_dataset("titanic")

# draw jointplot with
# reg kind
sns.jointplot(x = "age", y = "fare",
              kind = "reg", data = data,
              dropna = True)

# show the plot
plt.show()

# This code is contributed
# by Deepanshu Rustagi.
輸出:

相關用法
- Python os._exit()用法及代碼示例
- Python os.WEXITSTATUS()用法及代碼示例
- Python os.abort()用法及代碼示例
- Python os.renames()用法及代碼示例
- Python os.lseek()用法及代碼示例
- Python PyTorch sin()用法及代碼示例
- Python Sympy Line.is_parallel()用法及代碼示例
- Python PIL GaussianBlur()用法及代碼示例
- Python Numpy np.hermefit()用法及代碼示例
- Python Numpy np.hermevander()用法及代碼示例
- Python Method和Function的區別用法及代碼示例
- Python TextBlob.word_counts()用法及代碼示例
- Python sympy.GreaterThan()用法及代碼示例
- Python sympy.StrictLessThan()用法及代碼示例
- Python sympy.LessThan()用法及代碼示例
- Python sympy.StrictGreaterThan()用法及代碼示例
注:本文由純淨天空篩選整理自deepanshu_rustagi大神的英文原創作品 Python – seaborn.jointplot() method。非經特殊聲明,原始代碼版權歸原作者所有,本譯文未經允許或授權,請勿轉載或複製。
