Matplotlib是Python中令人驚歎的可視化庫,用於數組的二維圖。 Matplotlib是一個基於NumPy數組的多平台數據可視化庫,旨在與更廣泛的SciPy堆棧配合使用。
matplotlib.ticker.LogLocator
這個matplotlib.ticker.LogLocator類用於確定對數軸的刻度位置。在此類中,刻度線的位置為:subs [j] * base ** i。
用法: class matplotlib.ticker.LogLocator(base=10.0, subs=(1.0, ), numdecs=4, numticks=None)
參數:
- subs:它是一個可選參數,可以為None,也可以為字符串或浮點數序列。默認為(1.0,)。它提供了用於放置刻度的基數的整數次冪。僅在基數的整數次冪時,默認位置才會打勾。 auto和all是此處唯一接受的字符串值。刻度線正好位於‘auto’的整數次冪之間,而“全部”則接受整數次冪。在此,無值等於‘auto’。
該類的方法:
- base(self, base):此方法用於設置對數刻度的底數。
- nonsingular(self, vmin, vmax):它用於根據需要擴展範圍以避免奇異。
- set_params(self, base=None, subs=None, numdecs=None, numticks=None):用於在刻度內設置參數。
- tick_values(self, vmin, vmax):此方法返回位於vmin和vmax範圍之間的刻度線的值。
- subs(self, subs):它用於為每個基數i * subs [j]設置日誌刻度的次要刻度。
- view_limit(self, vmin, vmax):該方法在智能選擇競爭限製時派上用場。
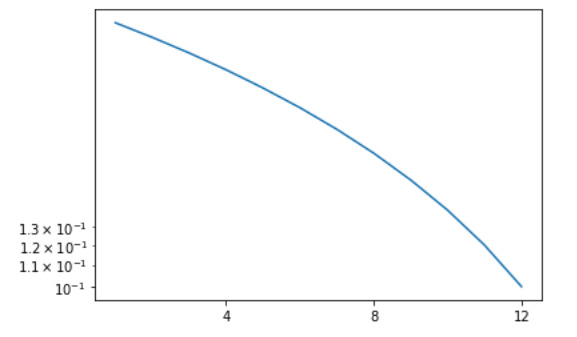
範例1:
import matplotlib.pyplot as plt
from matplotlib.ticker import MultipleLocator, LogLocator

x = [1, 2, 3, 4, 5, 6,
     7, 8, 9, 10, 11, 12]

y = [0.32, 0.30, 0.28, 0.26,
     0.24, 0.22, 0.20, 0.18,
     0.16, 0.14, 0.12, 0.10]

fig = plt.figure()
ax1 = fig.add_subplot(111)

x_major = MultipleLocator(4)
x_minor = MultipleLocator(1)

ax1.xaxis.set_major_locator(x_major)
ax1.xaxis.set_minor_locator(x_minor)
ax1.set_yscale("log")

y_major = LogLocator(base = 10)
y_minor = LogLocator(base = 10, subs =[1.1, 1.2, 1.3])

ax1.yaxis.set_major_locator(y_major)
ax1.yaxis.set_minor_locator(y_minor)

ax1.plot(x, y)

plt.show()
輸出:
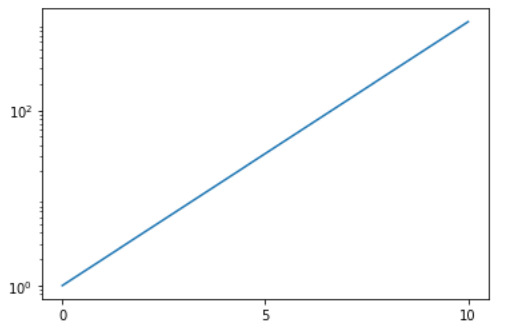
範例2:
import numpy as np
import matplotlib.pyplot as plt
from matplotlib.ticker import LogLocator


x = np.linspace(0, 10, 10)
y = 2**x

f = plt.figure()
ax = f.add_subplot(111)
plt.yscale('log')

ax.yaxis.set_major_locator(LogLocator(base = 100))

ax.plot(x, y)

plt.show()
輸出:
相關用法
- Python Matplotlib.ticker.MultipleLocator用法及代碼示例
- Python Matplotlib.gridspec.GridSpec用法及代碼示例
- Python Matplotlib.patches.CirclePolygon用法及代碼示例
- Python Matplotlib.colors.Normalize用法及代碼示例
注:本文由純淨天空篩選整理自RajuKumar19大神的英文原創作品 Matplotlib.ticker.LogLocator Class in Python。非經特殊聲明,原始代碼版權歸原作者所有,本譯文未經允許或授權,請勿轉載或複製。