Matplotlib是Python中令人驚歎的可視化庫,用於數組的二維圖。 Matplotlib是一個基於NumPy數組的多平台數據可視化庫,旨在與更廣泛的SciPy堆棧配合使用。
matplotlib.patches.CirclePolygon
這個matplotlib.patches.CirclePolygon類用於圓形補丁的polygon-approximation。它用來在xy = (x, y)具有已提供的半徑。具有解析度邊的規則多邊形與此圓近似。
用法: class matplotlib.patches.CirclePolygon(xy, radius=5, resolution=20, **kwargs)
參數:
- xy:要繪製的圓的原點坐標。
- radius:這是一個可選參數,用於設置圓的半徑。默認值為5個單位。
- resolution:顧名思義,它用於設置圖像分辨率。它是可選的,默認為20。
下表提供了可選的有效kwargs;
| PROPERTY | DESCRIPTION |
|---|---|
| agg_filter | 一個過濾器函數,它接受一個(m,n,3)浮點數組,一個dpi值返回一個(m,n,3)數組 |
| alpha | 浮點數或無 |
| animated | bool |
| 抗鋸齒或抗鋸齒 | unknown |
| capstyle | {‘butt’,“回合”,‘projecting’} |
| clip_box | Bbox |
| clip_on | bool |
| clip_path | [(Path,Transform)|補丁|無] |
| color | rgba元組的顏色或順序 |
| contains | callable |
| edgecolor或ec或edgecolors | 顏色或無或‘auto’ |
| facecolor或fc或facecolors | 顏色或無 |
| figure | figure |
| fill | bool |
| gid | str |
| hatch | {‘/’、‘\’、‘|’、‘-’、‘+’、‘x’, ‘o’、‘O’、‘.’、‘*’} |
| in_layout | bool |
| joinstyle | {‘miter’,“回合”,‘bevel’} |
| 線型或ls | {“-”,“-”,“-。”,“:”,“,(偏移量,on-off-seq),...} |
| 線寬或線寬或lw | 浮點數或無 |
| path_effects | AbstractPathEffect |
| picker | 無或布爾或浮點數或可贖回 |
| path_effects | AbstractPathEffect |
| picker | float或callable [[Artist,Event],Tuple [bool,dict]] |
| rasterized | 布爾還是無 |
| sketch_params | (比例:浮點數,長度:浮點數,隨機性:浮點數) |
| snap | 布爾還是無 |
| transform | matplotlib.transforms.Transform |
| url | str |
| visible | bool |
| zorder | float |
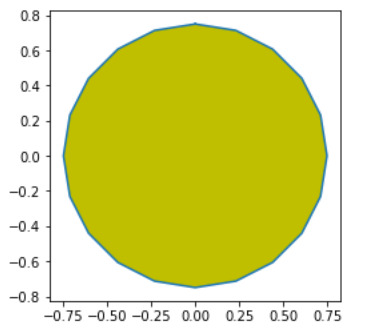
範例1:
import matplotlib.pyplot as plt
from matplotlib.patches import CirclePolygon


circle = CirclePolygon((0, 0),
                       radius = 0.75,
                       fc = 'y')

plt.gca().add_patch(circle)

verts = circle.get_path().vertices
trans = circle.get_patch_transform()
points = trans.transform(verts)

plt.plot(points[:, 0], points[:, 1])
plt.axis('scaled')

plt.show()
輸出:
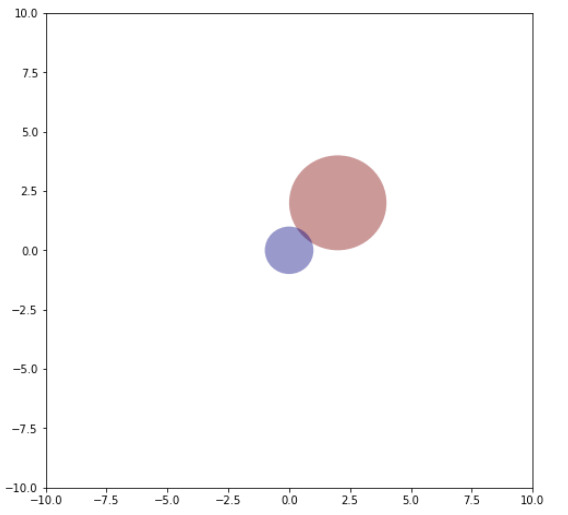
範例2:
import numpy as np
import matplotlib
from matplotlib.patches import Circle, Wedge, Polygon, Ellipse
from matplotlib.collections import PatchCollection
import matplotlib.pyplot as plt
import matplotlib.patches as matpatches


fig, ax = plt.subplots(figsize =(8, 8))
patches = []


circle = Circle((2, 2), 2)
patches.append(circle)


polygon = matpatches.PathPatch(patches[0].get_path())
patches.append(polygon)


colors = 2 * np.random.rand(len(patches))
p = PatchCollection(patches,
                    cmap = matplotlib.cm.jet,
                    alpha = 0.4)

p.set_array(np.array(colors))
ax.add_collection(p)

plt.axis([-10, 10, -10, 10])

plt.show()
輸出:
相關用法
- Python Matplotlib.ticker.MultipleLocator用法及代碼示例
- Python Matplotlib.gridspec.GridSpec用法及代碼示例
- Python Matplotlib.colors.Normalize用法及代碼示例
- Python Matplotlib.colors.LogNorm用法及代碼示例
注:本文由純淨天空篩選整理自RajuKumar19大神的英文原創作品 Matplotlib.patches.CirclePolygon class in Python。非經特殊聲明,原始代碼版權歸原作者所有,本譯文未經允許或授權,請勿轉載或複製。