Matplotlib是Python中令人驚歎的可視化庫,用於數組的二維圖。 Matplotlib是一個基於NumPy數組的多平台數據可視化庫,旨在與更廣泛的SciPy堆棧配合使用。
matplotlib.ticker.LogFormatter
這個 matplotlib.ticker.LogFormatter類用於格式化對數或符號對數刻度的刻度。它或者直接實例化,或者被子類化。
語法:class matplotlib.ticker.LogFormatter(base = 10.0,labelOnlyBase = False,minor_thresholds = None,linthresh = None)
Parameters:
- base:它是用於所有計算的對數底的可選浮點值。默認情況下為10。
- labelOnlyBase:它是一個可選的布爾值,如果將其設置為True,則標簽僅在整數的冪為底數時打勾。通常,對於大刻度線,它為True;對於小刻度線,它為False。默認情況下為False。
- minor_thresholds:它是兩個值(即,子集,全部)的可選元組。如果將labelOnlyBase設置為False,則這兩個數字將指示刻度的標簽,而不是基數的整數次冪;通常,這些是較小的滴答聲。軸數據範圍的對數是控製參數。
- linthresh:如果使用對稱對數刻度,則必須提供此參數。
該類的方法:
- format_data(self, value):它返回該值的未指定位置的完整字符串表示形式。
- format_data_short(self, value):它返回數字的短格式字符串表示形式。
- label_minor(self, labelOnlyBase):它用於打開或關閉次要刻度標簽。
- set_locs(self, locs=None):它使用軸視圖控製刻度線的標簽。
範例1:
import numpy as np
import matplotlib.pyplot as plt
from matplotlib.ticker import LogFormatterSciNotation
class CustomTicker(LogFormatterSciNotation):
def __call__(self, x, pos = None):
if x not in [0.1, 1, 10]:
return LogFormatterSciNotation.__call__(self, x, pos = None)
else:
return "{x:g}".format(x = x)
fig = plt.figure(figsize =[7, 7])
ax = fig.add_subplot(111)
ax.set_yscale('log')
ax.set_xscale('log')
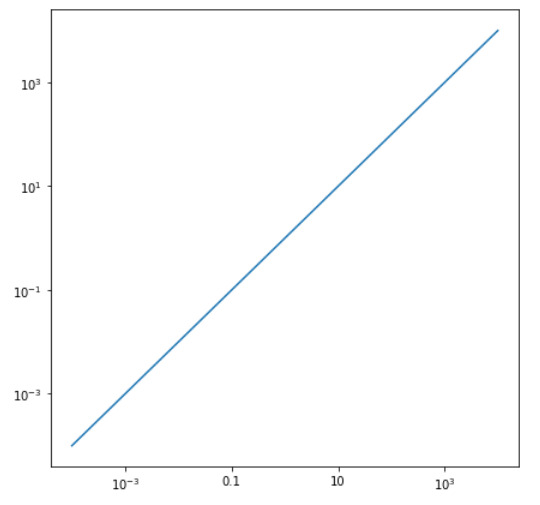
ax.plot(np.logspace(-4, 4), np.logspace(-4, 4))
ax.xaxis.set_major_formatter(CustomTicker())
plt.show()輸出:
範例2:
import matplotlib.pyplot as plt
from matplotlib.ticker import LogFormatter
import numpy as np
fig, axes = plt.subplots(4, figsize =(12, 24))
dt = 0.01
t = np.arange(dt, 20.0, dt)
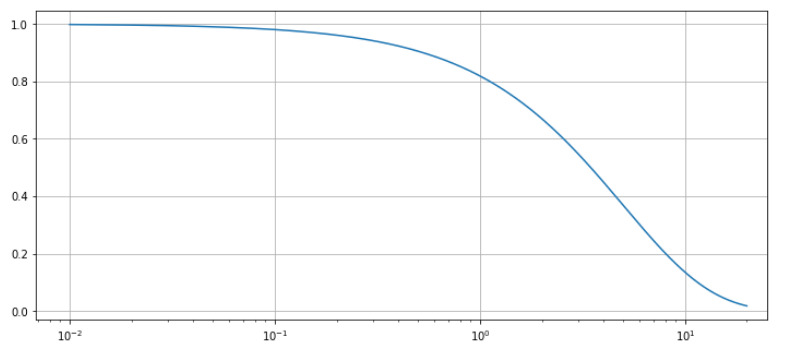
# first plot doesn't use a formatter
axes[0].semilogx(t, np.exp(-t / 5.0))
axes[0].set_xlim([0, 25])
axes[0].grid()
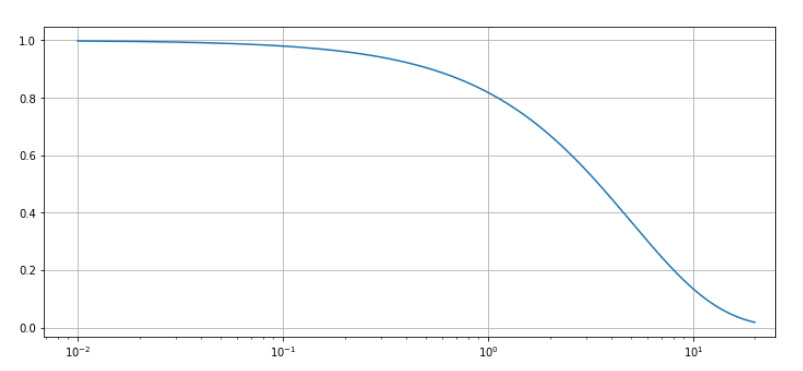
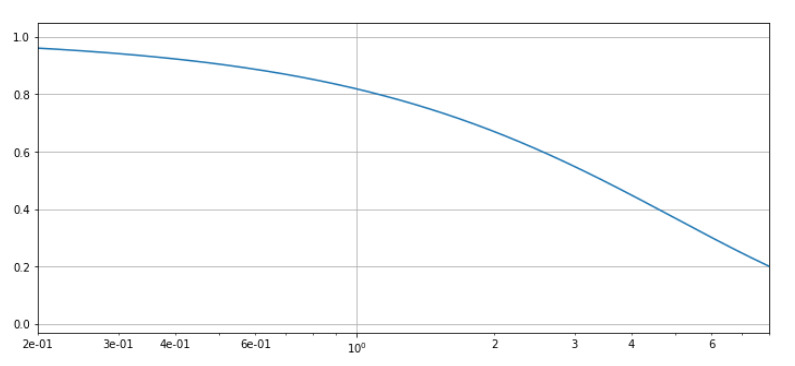
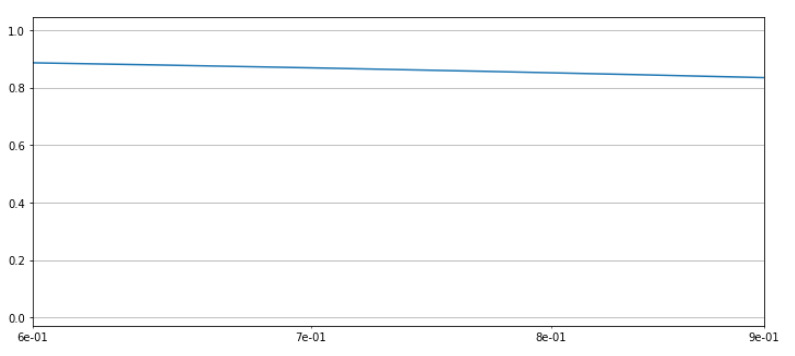
xlims = [[0, 25], [0.2, 8], [0.6, 0.9]]
for ax, xlim in zip(axes[1:], xlims):
ax.semilogx(t, np.exp(-t / 5.0))
formatter = LogFormatter(labelOnlyBase = False,
minor_thresholds = (2, 0.4))
ax.get_xaxis().set_minor_formatter(formatter)
ax.set_xlim(xlim)
ax.grid()
plt.show()輸出:
相關用法
- Python Matplotlib.ticker.MultipleLocator用法及代碼示例
- Python Matplotlib.gridspec.GridSpec用法及代碼示例
- Python Matplotlib.patches.CirclePolygon用法及代碼示例
- Python Matplotlib.colors.Normalize用法及代碼示例
注:本文由純淨天空篩選整理自RajuKumar19大神的英文原創作品 Matplotlib.ticker.LogFormatter Class in Python。非經特殊聲明,原始代碼版權歸原作者所有,本譯文未經允許或授權,請勿轉載或複製。