Matplotlib是Python中令人驚歎的可視化庫,用於數組的二維圖。 Matplotlib是一個基於NumPy數組的多平台數據可視化庫,旨在與更廣泛的SciPy堆棧配合使用。
matplotlib.ticker.LinearLocator
這個matplotlib.ticker.LinearLocator 類用於確定刻度位置。在第一次調用時,該函數嘗試設置刻度數以進行良好的刻度劃分。之後,隨著刻度數的固定,交互式導航得到了改善。預設參數用於設置 locs基於lom, 這是vmin,vmax-> locs的字典映射。
用法: class matplotlib.ticker.LinearLocator(numticks=None, presets=None)
參數:
- numticks:總滴答數。
- presets:它用於基於lom設置位置,lom是vmin,vmax-> locs的字典映射。
該類的方法:
- set_params(self, numticks=None, presets=None):它用於在此定位器內設置參數。
tick_values(self, vmin, vmax):它返回位於vmin和vmax之間的刻度線的值。- view_limits(self, vmin, vmax):它用於智能地選擇視圖限製。
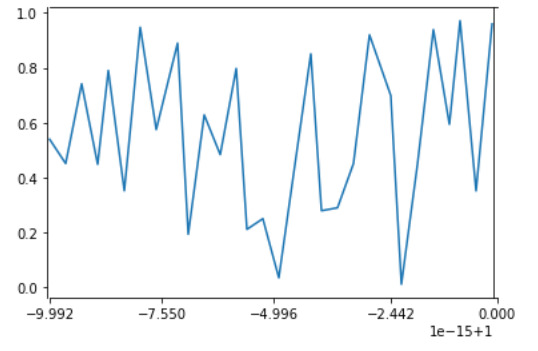
範例1:
import numpy as np
import matplotlib.pyplot as plt
import matplotlib.ticker


xGrid = np.linspace(1-1e-14, 1-1e-16, 30,
                    dtype = np.longdouble)

y = np.random.rand(len(xGrid))

plt.plot(xGrid, y)
plt.xlim(1-1e-14, 1)

loc = matplotlib.ticker.LinearLocator(numticks = 5)
plt.gca().xaxis.set_major_locator(loc)

plt.show()
輸出:
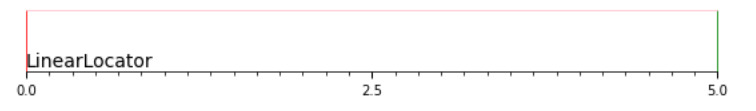
範例2:
import numpy as np
import matplotlib.pyplot as plt
import matplotlib.ticker as ticker


# Setup a plot such that only the bottom
# spine is shown
def setup(ax):

    ax.spines['right'].set_color('green')
    ax.spines['left'].set_color('red')

    ax.yaxis.set_major_locator(ticker.NullLocator())
    ax.spines['top'].set_color('pink')
    ax.xaxis.set_ticks_position('bottom')

    ax.tick_params(which ='major', width = 1.00)
    ax.tick_params(which ='major', length = 5)
    ax.tick_params(which ='minor', width = 0.75)
    ax.tick_params(which ='minor', length = 2.5)

    ax.set_xlim(0, 5)
    ax.set_ylim(0, 1)
    ax.patch.set_alpha(0.0)

plt.figure(figsize =(8, 6))
n = 8
ax = plt.subplot(n, 1, 4)
setup(ax)
ax.xaxis.set_major_locator(ticker.LinearLocator(3))
ax.xaxis.set_minor_locator(ticker.LinearLocator(31))

ax.text(0.0, 0.1, "LinearLocator",
        fontsize = 14,
        transform = ax.transAxes)

plt.subplots_adjust(left = 0.05,
                    right = 0.95,
                    bottom = 0.05,
                    top = 1.05)

plt.show()
輸出:
相關用法
- Python Matplotlib.ticker.MultipleLocator用法及代碼示例
- Python Matplotlib.gridspec.GridSpec用法及代碼示例
- Python Matplotlib.patches.CirclePolygon用法及代碼示例
- Python Matplotlib.colors.Normalize用法及代碼示例
注:本文由純淨天空篩選整理自RajuKumar19大神的英文原創作品 Matplotlib.ticker.LinearLocator Class in Python。非經特殊聲明,原始代碼版權歸原作者所有,本譯文未經允許或授權,請勿轉載或複製。