Matplotlib是Python中令人驚歎的可視化庫,用於數組的二維圖。 Matplotlib是一個基於NumPy數組的多平台數據可視化庫,旨在與更廣泛的SciPy堆棧配合使用。
matplotlib.text.OffsetFrom
這個matplotlib.text.OffsetFrom class是用於處理批注的可調用幫助程序類。
用法: class matplotlib.text.OffsetFrom(artist, ref_coord, unit=’points’)
參數:
- artist:該對象用於計算偏移量。它通常是Artist,BboxBase或Transform。
- ref_coord:是長度2序列。如果是Artist或BboxBase,則此值是偏移量原點到位置的偏移量(以藝術家邊界框的分數為單位),而如果Artist是Transform,則該偏移量原點是應用於此值的變換。
- unit:它用於管理要用於偏移輸入的屏幕單位(像素或點)。
該類的方法:
- get_unit(self):它是__call__使用的轉換輸入的單位。
- set_unit(self, unit):它是__call__使用的轉換輸入的單位,其中,單位參數在‘points’或‘pixels’中。
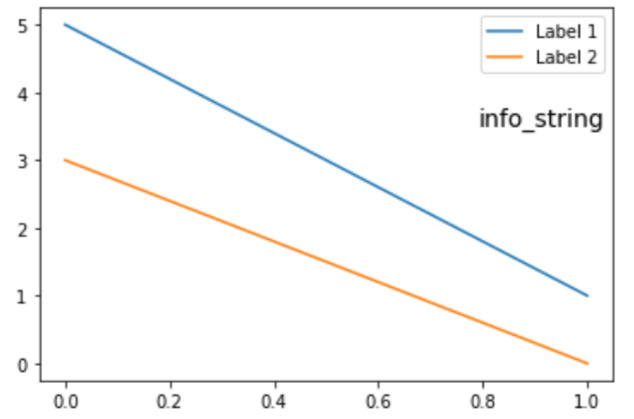
範例1:
import matplotlib.pyplot as plt
import matplotlib.text

fig, ax = plt.subplots()

ax.plot([5,1], label="Label 1")
ax.plot([3,0], label="Label 2")

legend = ax.legend(loc="upper right")

# Create offset from lower right
# corner of legend box, (1.0,0) is
# the coordinates of the offset point
# in the legend coordinate system
offset = matplotlib.text.OffsetFrom(legend, (1.0, 0.0))

# Create annotation. Top right corner
# located -20 pixels below the offset
# point (lower right corner of legend).
ax.annotate("info_string",
            xy = (0,0),
            size = 14,
            xycoords = 'figure fraction',
            xytext = (0,-20),
            textcoords = offset,
            horizontalalignment = 'right',
            verticalalignment = 'top')

# Draw the canvas for offset to take effect
fig.canvas.draw()

plt.show()
輸出:
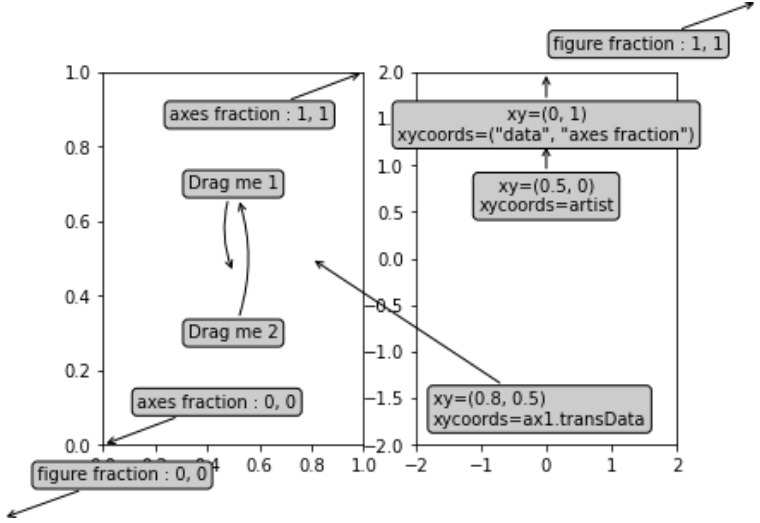
範例2:
import matplotlib.pyplot as plt
from matplotlib.patches import Ellipse
import numpy as np
from matplotlib.text import OffsetFrom


fig, (ax1, ax2) = plt.subplots(1, 2)

bbox_args = dict(boxstyle ="round", fc ="0.8")
arrow_args = dict(arrowstyle ="->")

# Here we'll demonstrate the extents of the coordinate system and how
# we place annotating text.

ax1.annotate('figure fraction:0, 0',
             xy =(0, 0),
             xycoords ='figure fraction',
             xytext =(20, 20),
             textcoords ='offset points',
             ha = "left",
             va = "bottom",
             bbox = bbox_args,
             arrowprops = arrow_args)

ax1.annotate('figure fraction:1, 1',
             xy =(1, 1),
             xycoords ='figure fraction',
             xytext = (-20, -20),
             textcoords ='offset points',
             ha = "right",
             va = "top",
             bbox = bbox_args,
             arrowprops = arrow_args)

ax1.annotate('axes fraction:0, 0',
             xy = (0, 0),
             xycoords ='axes fraction',
             xytext = (20, 20),
             textcoords ='offset points',
             ha = "left",
             va = "bottom",
             bbox = bbox_args,
             arrowprops = arrow_args)

ax1.annotate('axes fraction:1, 1',
             xy =(1, 1),
             xycoords ='axes fraction',
             xytext = (-20, -20),
             textcoords ='offset points',
             ha = "right",
             va = "top",
             bbox = bbox_args,
             arrowprops = arrow_args)

# It is also possible to generate
# draggable annotations
an1 = ax1.annotate('Drag me 1', xy =(.5, .7),
                   xycoords ='data',
                   ha ="center", va ="center",
                   bbox = bbox_args,
                   )

an2 = ax1.annotate('Drag me 2', xy =(.5, .5),
                   xycoords = an1,
                   xytext =(.5, .3),
                   textcoords = 'axes fraction',
                   ha = "center",
                   va = "center",
                   bbox = bbox_args,
                   arrowprops = dict(patchB = an1.get_bbox_patch(),
                                   connectionstyle = "arc3, rad = 0.2",
                                   **arrow_args))
an1.draggable()
an2.draggable()

an3 = ax1.annotate('', xy =(.5, .5), xycoords = an2,
                   xytext =(.5, .5), textcoords = an1,
                   ha ="center", va ="center",
                   bbox = bbox_args,
                   arrowprops = dict(patchA = an1.get_bbox_patch(),
                                   patchB = an2.get_bbox_patch(),
                                   connectionstyle ="arc3, rad = 0.2",
                                   **arrow_args))

# Finally we'll show off some more
# complex annotation and placement
text = ax2.annotate('xy =(0, 1)\nxycoords = ("data", "axes fraction")',
                    xy =(0, 1),
                    xycoords = ("data", 'axes fraction'),
                    xytext = (0, -20),
                    textcoords ='offset points',
                    ha = "center",
                    va = "top",
                    bbox = bbox_args,
                    arrowprops = arrow_args)

ax2.annotate('xy =(0.5, 0)\nxycoords = artist',
             xy =(0.5, 0.),
             xycoords = text,
             xytext = (0, -20),
             textcoords = 'offset points',
             ha = "center",
             va = "top",
             bbox = bbox_args,
             arrowprops = arrow_args)

ax2.annotate('xy =(0.8, 0.5)\nxycoords = ax1.transData',
             xy =(0.8, 0.5),
             xycoords = ax1.transData,
             xytext = (10, 10),
             textcoords = OffsetFrom(ax2.bbox, (0, 0), "points"),
             ha = "left",
             va = "bottom",
             bbox = bbox_args,
             arrowprops = arrow_args)

ax2.set(xlim =[-2, 2], ylim =[-2, 2])
plt.show()
輸出:
相關用法
- Python Matplotlib.ticker.MultipleLocator用法及代碼示例
- Python Matplotlib.gridspec.GridSpec用法及代碼示例
- Python Matplotlib.patches.CirclePolygon用法及代碼示例
- Python Matplotlib.colors.Normalize用法及代碼示例
注:本文由純淨天空篩選整理自RajuKumar19大神的英文原創作品 Matplotlib.text.OffsetFrom class in python。非經特殊聲明,原始代碼版權歸原作者所有,本譯文未經允許或授權,請勿轉載或複製。