Matplotlib是Python中令人驚歎的可視化庫,用於數組的二維圖。 Matplotlib是一個基於NumPy數組的多平台數據可視化庫,旨在與更廣泛的SciPy堆棧配合使用。
matplotlib.colors.DivergingNorm
matplotlib.colors.DivergingNorm類屬於matplotlib.colors模塊。 matplotlib.colors模塊用於將顏色或數字參數轉換為RGBA或RGB。此模塊用於將數字映射到顏色或以一維顏色數組(也稱為colormap)進行顏色規格轉換。
matplotlib.colors.DivergingNorm類在圍繞概念中心以不均勻或不相等的變化率映射數據時非常有用。例如,數據範圍介於-2到2之間,以0為中心或mid-point。
用法: matplotlib.colors.DivergingNorm(vcenter, vmin, vmax)
參數:
- 虛擬中心:它接受一個浮點值,該值在規範化中定義0.5數據值。
- vmin:它是一個可選參數,它接受浮點值並在規範化中定義0.0數據值,默認為數據集的最小值。
- vmax:它是一個可選參數,它接受浮點值並在規範化中定義1.0數據值,默認為數據集的最大值。
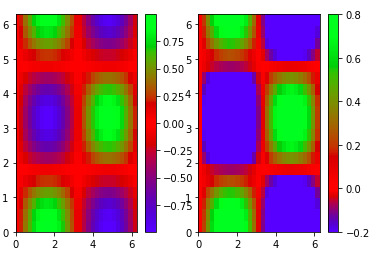
範例1:
import numpy
from matplotlib import pyplot as plt
from matplotlib import colors


# dummy data to plot
x = numpy.linspace(0, 2*numpy.pi, 30)
y = numpy.linspace(0, 2*numpy.pi, 20)
[A, B] = numpy.meshgrid(x, y)
Q = numpy.sin(A)*numpy.cos(B)

fig = plt.figure()
plt.ion()

#  yellow to green to red
# colormap
plt.set_cmap('brg')

ax = fig.add_subplot(1, 2, 1)
plt.pcolor(A, B, Q)
plt.colorbar()

ax = fig.add_subplot(1, 2, 2)

# defining the scale, with white
# at zero
vmin = -0.2
vmax = 0.8
norms = colors.DivergingNorm(vmin=vmin,
                             vcenter=0,
                             vmax=vmax)

plt.pcolor(A, B, Q,
           vmin=vmin,
           vmax=vmax,
           norm=norms)

plt.colorbar()
輸出:
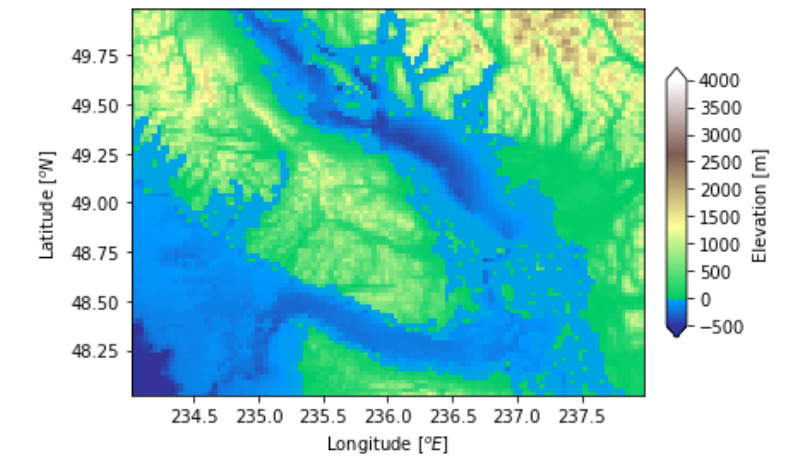
範例2:
import numpy as np
import matplotlib.pyplot as plt
import matplotlib.cbook as cbook
import matplotlib.colors as colors

file = cbook.get_sample_data('topobathy.npz',
                             asfileobj = False)

with np.load(file) as example:
    topo = example['topo']
    longi = example['longitude']
    latit = example['latitude']

figure, axes = plt.subplots(constrained_layout = True)

# creating a colormap that
# has land and ocean clearly
# delineated and of the
# same length (256 + 256)
undersea = plt.cm.terrain(np.linspace(0, 0.17, 256))
land = plt.cm.terrain(np.linspace(0.25, 1, 256))
every_colors = np.vstack((undersea, land))

terrain_map = colors.LinearSegmentedColormap.from_list('terrain_map',
                                                       every_colors)

# the center is offset so that
# the land has more dynamic range
# while making the norm
diversity_norm = colors.DivergingNorm(vmin =-500,
                                      vcenter = 0,
                                      vmax = 4000)

pcm = axes.pcolormesh(longi, latit, topo,
                      rasterized = True,
                      norm = diversity_norm,
                      cmap = terrain_map, )

axes.set_xlabel('Longitude $[^o E]$')
axes.set_ylabel('Latitude $[^o N]$')
axes.set_aspect(1 / np.cos(np.deg2rad(49)))

figure.colorbar(pcm, shrink = 0.6,
                extend ='both',
                label ='Elevation [m]')
plt.show()
輸出:
相關用法
- Python Matplotlib.ticker.MultipleLocator用法及代碼示例
- Python Matplotlib.gridspec.GridSpec用法及代碼示例
- Python Matplotlib.patches.CirclePolygon用法及代碼示例
- Python Matplotlib.colors.Normalize用法及代碼示例
注:本文由純淨天空篩選整理自RajuKumar19大神的英文原創作品 Matplotlib.colors.DivergingNorm class in Python。非經特殊聲明,原始代碼版權歸原作者所有,本譯文未經允許或授權,請勿轉載或複製。