Matplotlib是Python中令人驚歎的可視化庫,用於數組的二維圖。 Matplotlib是一個基於NumPy數組的多平台數據可視化庫,旨在與更廣泛的SciPy堆棧配合使用。
matplotlib.colors.BoundaryNorm
matplotlib.colors.BoundaryNorm類屬於matplotlib.colors模塊。 matplotlib.colors模塊用於將顏色或數字參數轉換為RGBA或RGB。此模塊用於將數字映射到顏色或以一維顏色數組(也稱為colormap)進行顏色規格轉換。
matplotlib.colors.BoundaryNorm類用於基於離散間隔創建顏色圖。 BoundaryNorm將值映射到整數,這與Normalize或LogNorm映射到0到1的間隔不同。分段線性插值可用於映射到o-間隔,但是,使用整數更簡單,並且減少了數量在整數和浮點數之間來回轉換。
參數:
- boundaries:這是一個像對象的數組,它單調增加邊界序列
- ncolor:它接受一個整數值,該值表示將要使用的顏色圖中的多種顏色。
- clip:它接受布爾值,並且是一個可選參數。如果剪輯是
True,則超出範圍且它們位於bounds [0]之下的值將映射為0,而如果它們位於boundary [-1]之上,則將它們映射為ncolors-1。如果剪輯設置為False,則超出範圍的值且它們低於boundaries[0]被映射為-1,而如果它們在bounds [-1]之上,則它們被映射為ncolor。這Colormap.__call__()將它們轉換為有效索引。
注意:箱的邊由邊界定義,並且落在箱中的數據被映射到相同的顏色索引。如果ncolors不等於bin的數量,則使用線性插值為其選擇顏色。
範例1:
import numpy as np
import matplotlib.pyplot as plt
from matplotlib.collections import LineCollection
from matplotlib.colors import ListedColormap, BoundaryNorm
a = np.linspace(0, 3 * np.pi, 500)
b = np.sin(a)
# this is the first derivative
dbda = np.cos(0.5 * (a[:-1] + a[1:]))
# Createing line segments so
# to color them individually
points = np.array([a, b]).T.reshape(-1, 1, 2)
set_of_segments = np.concatenate([points[:-1],
points[1:]],
axis = 1)
figure, axes = plt.subplots(2, 1,
sharex = True,
sharey = True)
# Mapping the data points with
# continous norm
continous_norm = plt.Normalize(dbda.min(),
dbda.max())
line_collection = LineCollection(set_of_segments,
cmap ='viridis',
norm = continous_norm)
# Set the values used for
# colormapping
line_collection.set_array(dbda)
line_collection.set_linewidth(2)
line = axes[0].add_collection(line_collection)
figure.colorbar(line, ax = axes[0])
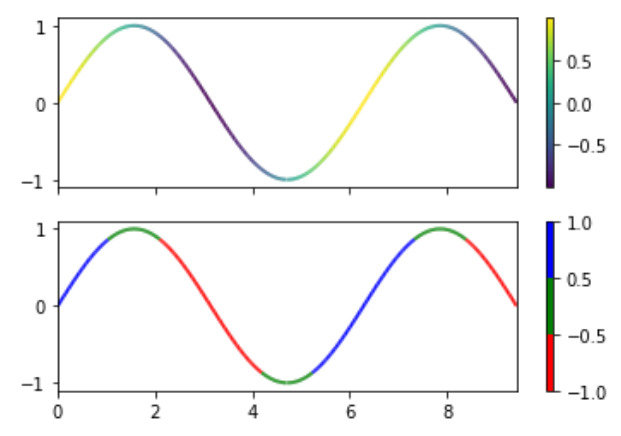
# Use a boundary norm instead
cmap = ListedColormap(['r', 'g', 'b'])
boundary_norm = BoundaryNorm([-1, -0.5, 0.5, 1],
cmap.N)
line_collection = LineCollection(set_of_segments,
cmap = cmap,
norm = boundary_norm)
line_collection.set_array(dbda)
line_collection.set_linewidth(2)
line = axes[1].add_collection(line_collection)
figure.colorbar(line, ax = axes[1])
axes[0].set_xlim(a.min(), a.max())
axes[0].set_ylim(-1.1, 1.1)
plt.show()輸出:
範例2:
import numpy as np
import matplotlib as mpl
import matplotlib.pylab as plt
# setup the plot
figure, axes = plt.subplots(1, 1,
figsize=(6, 6))
# defining random data
x = np.random.rand(20)
y = np.random.rand(20)
tag = np.random.randint(0, 20, 20)
tag[10:12] = 0
# defining the colormap
cmap = plt.cm.jet
# extracting all colors
cmaplist = [cmap(i) for i in range(cmap.N)]
# making first color entry grey
cmaplist[0] = (.5, .5, .5, 1.0)
# new map
cmap = mpl.colors.LinearSegmentedColormap.from_list(
'Custom cmap', cmaplist, cmap.N)
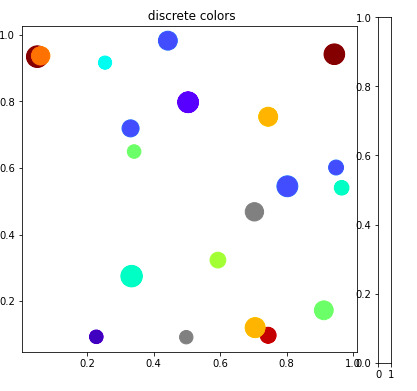
# defining the bins and norms
bounds = np.linspace(0, 20, 21)
norm = mpl.colors.BoundaryNorm(bounds,
cmap.N)
# the scatter
scat = axes.scatter(x, y, c=tag,
s=np.random.randint(100,
500,
20),
cmap=cmap, norm=norm)
# axes for the colorbar
ax2 = figure.add_axes([0.95, 0.1,
0.03, 0.8])
axes.set_title(' discrete colors')輸出:
相關用法
- Python Matplotlib.ticker.MultipleLocator用法及代碼示例
- Python Matplotlib.gridspec.GridSpec用法及代碼示例
- Python Matplotlib.patches.CirclePolygon用法及代碼示例
- Python Matplotlib.colors.Normalize用法及代碼示例
注:本文由純淨天空篩選整理自RajuKumar19大神的英文原創作品 Matplotlib.colors.BoundaryNorm class in Python。非經特殊聲明,原始代碼版權歸原作者所有,本譯文未經允許或授權,請勿轉載或複製。