rweibull()R語言中的函數用於計算威布爾分布的隨機密度。
用法: rweibull(N, shape)
參數:
N:樣本量
shape:形狀參數
範例1:
# R program to compute random
# Weibull Density

# Setting seed for
# random number generation
set.seed(1000)

# Set sample size
N <- 20

# Calling rweibull() Function
y <- rweibull(N, shape = 0.5)
y
輸出:
 [1] 1.24347372 0.07615159 4.71808321 0.13687770 0.43674779 7.24744843
 [7] 0.09171405 0.29014465 2.35173196 1.85531597 1.10250171 0.07863894
[13] 1.31925387 0.02076093 0.07234868 6.85850214 0.50129483 0.20600265
[19] 6.08499134 0.28943273
範例2:
# R program to compute random
# Weibull Density

# Setting seed for
# random number generation
set.seed(1000)

# Set sample size
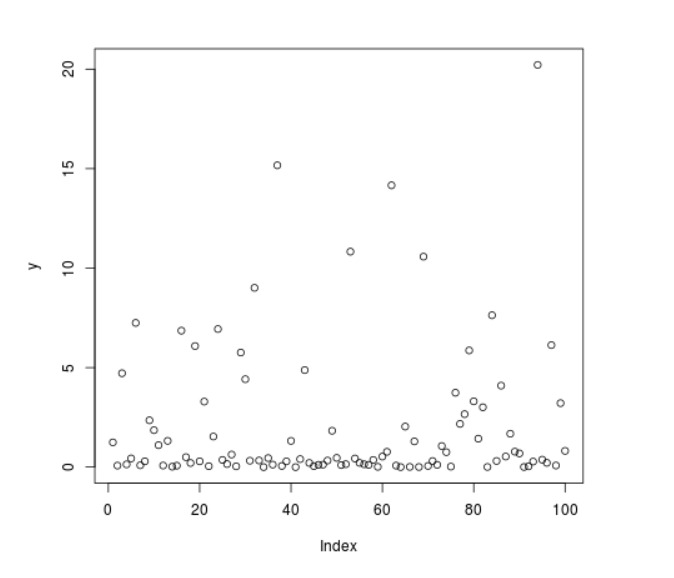
N <- 100

# Calling rweibull() Function
y <- rweibull(N, shape = 0.5)

# Plot a graph
plot(y)
輸出:
相關用法
- R語言 rf()用法及代碼示例
- R語言 rchisq()用法及代碼示例
- R語言 rlnorm()用法及代碼示例
- R語言 rcauchy()用法及代碼示例
- R語言 rlogis()用法及代碼示例
- R語言 rnbinom()用法及代碼示例
- R語言 rpois()用法及代碼示例
- R語言 rsignrank()用法及代碼示例
- R語言 rwilcox()用法及代碼示例
- R語言 dweibull()用法及代碼示例
- R語言 pweibull()用法及代碼示例
- R語言 qweibull()用法及代碼示例
- R語言 density()用法及代碼示例
- R語言 dunif()用法及代碼示例
- R語言 dchisq()用法及代碼示例
- R語言 pchisq()用法及代碼示例
- R語言 dcauchy()用法及代碼示例
- R語言 pcauchy()用法及代碼示例
- R語言 plogis()用法及代碼示例
- R語言 dlogis()用法及代碼示例
- R語言 plnorm()用法及代碼示例
- R語言 qchisq()用法及代碼示例
- R語言 dlnorm()用法及代碼示例
- R語言 dnbinom()用法及代碼示例
注:本文由純淨天空篩選整理自nidhi_biet大神的英文原創作品 Compute Randomly Drawn Weibull Density in R Programming – rweibull() Function。非經特殊聲明,原始代碼版權歸原作者所有,本譯文未經允許或授權,請勿轉載或複製。
