rcauchy()R語言中的函數用於計算一係列輸入之間的隨機柯西密度。
用法: rcauchy(N, scale)
參數:
N:樣本量
scale:縮放以繪製圖形
範例1:
# R program to generate
# random cauchy density points

# Setting seed for
# random number generation
set.seed(1000)

# Set sample size
N <- 20

# Calling rcauchy() Function
y <- rcauchy(N, scale = 10)
y
輸出:
 [1]   16.654755   -9.459054    3.740548  -14.639724 -193.891140    2.160767
 [7]  -10.735449  -37.226131    8.051377   10.392275   19.616577   -9.662595
[13]   15.442965   -4.484467   -9.147612    2.330620  431.105051  -22.117519
[19]    2.730892  -37.046773
範例2:
# R program to generate
# random cauchy density points

# Setting seed for
# random number generation
set.seed(1000)

# Set sample size
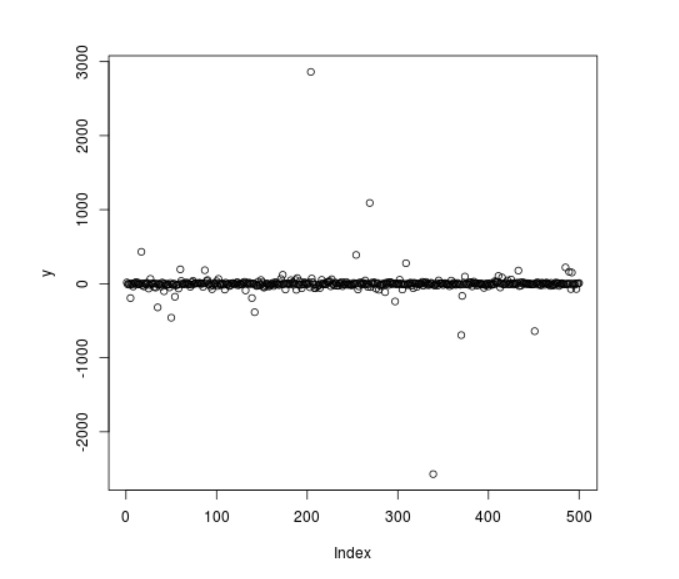
N <- 500

# Calling rcauchy() Function
y <- rcauchy(N, scale = 10)

# Plotting graph
plot(y)
輸出:
相關用法
- R語言 rf()用法及代碼示例
- R語言 rchisq()用法及代碼示例
- R語言 rlnorm()用法及代碼示例
- R語言 rlogis()用法及代碼示例
- R語言 rnbinom()用法及代碼示例
- R語言 rpois()用法及代碼示例
- R語言 rweibull()用法及代碼示例
- R語言 rsignrank()用法及代碼示例
- R語言 rwilcox()用法及代碼示例
- R語言 dcauchy()用法及代碼示例
- R語言 pcauchy()用法及代碼示例
- R語言 qcauchy()用法及代碼示例
- R語言 density()用法及代碼示例
- R語言 dunif()用法及代碼示例
- R語言 dchisq()用法及代碼示例
- R語言 pchisq()用法及代碼示例
- R語言 plogis()用法及代碼示例
- R語言 dlogis()用法及代碼示例
- R語言 plnorm()用法及代碼示例
- R語言 qchisq()用法及代碼示例
- R語言 dlnorm()用法及代碼示例
- R語言 dnbinom()用法及代碼示例
- R語言 pnbinom()用法及代碼示例
- R語言 dpois()用法及代碼示例
注:本文由純淨天空篩選整理自nidhi_biet大神的英文原創作品 Compute Randomly Drawn Cauchy Density in R Programming – rcauchy() Function。非經特殊聲明,原始代碼版權歸原作者所有,本譯文未經允許或授權,請勿轉載或複製。
