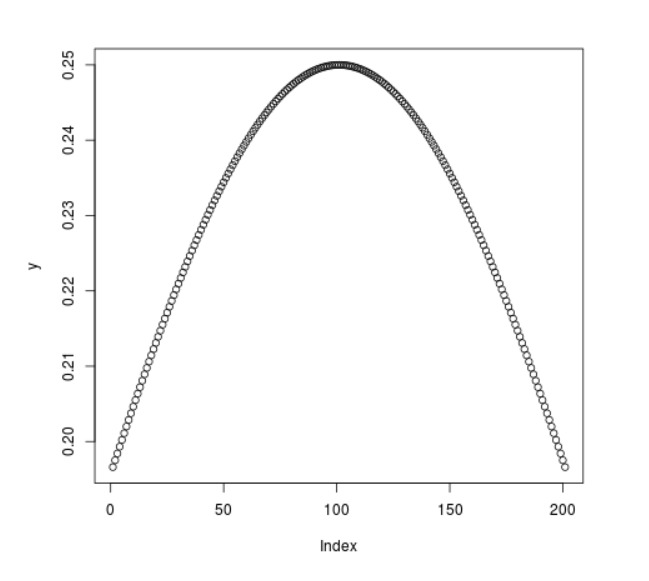
dlogis()R語言中的函數用於計算分布的邏輯密度。它還創建了邏輯分布密度圖。
用法: dlogis(vec)
參數:
vec:x-values 的密度向量
範例1:
# R program to calculate
# logistic density

# Create a vector of x-values
x <- seq(-1, 1, by = 0.1)

# Calling the dlogis() function
y <- dlogis(x)
y
輸出:
 [1] 0.1966119 0.2055003 0.2139097 0.2217129 0.2287842 0.2350037 0.2402607
 [8] 0.2444583 0.2475166 0.2493760 0.2500000 0.2493760 0.2475166 0.2444583
[15] 0.2402607 0.2350037 0.2287842 0.2217129 0.2139097 0.2055003 0.1966119
範例2:
# R program to calculate
# logistic density

# Create a vector of x-values
x <- seq(-1, 1, by = 0.01)

# Calling the dlogis() function
y <- dlogis(x)

# Plot the graph
plot(y)
輸出:
相關用法
- R語言 plogis()用法及代碼示例
- R語言 rlogis()用法及代碼示例
- R語言 density()用法及代碼示例
- R語言 qlogis()用法及代碼示例
- R語言 dunif()用法及代碼示例
- R語言 rf()用法及代碼示例
- R語言 dchisq()用法及代碼示例
- R語言 pchisq()用法及代碼示例
- R語言 dcauchy()用法及代碼示例
- R語言 pcauchy()用法及代碼示例
- R語言 rchisq()用法及代碼示例
- R語言 rlnorm()用法及代碼示例
- R語言 plnorm()用法及代碼示例
- R語言 rcauchy()用法及代碼示例
- R語言 qchisq()用法及代碼示例
- R語言 dlnorm()用法及代碼示例
- R語言 dnbinom()用法及代碼示例
- R語言 pnbinom()用法及代碼示例
- R語言 dpois()用法及代碼示例
- R語言 rnbinom()用法及代碼示例
- R語言 ppois()用法及代碼示例
- R語言 rpois()用法及代碼示例
- R語言 df()用法及代碼示例
- R語言 dweibull()用法及代碼示例
注:本文由純淨天空篩選整理自nidhi_biet大神的英文原創作品 Compute the Logistic Density in R Programming – dlogis() Function。非經特殊聲明,原始代碼版權歸原作者所有,本譯文未經允許或授權,請勿轉載或複製。
