dweibull()R語言中的函數用於計算威布爾分布的不同數值上的威布爾密度值。
用法: dweibull(x, shape)
參數:
x:數字向量
shape:形狀參數
範例1:
# R Program to compute
# Weibull Density

# Creating a sequence of x-values
x <- seq(-10, 10, by = 1)

# Calling dweibull() Function
y <- dweibull(x, shape = 0.2)
y
輸出:
 [1] 0.000000000 0.000000000 0.000000000 0.000000000 0.000000000 0.000000000
 [7] 0.000000000 0.000000000 0.000000000 0.000000000         Inf 0.073575888
[13] 0.036419388 0.023895654 0.017633032 0.013888170 0.011403732 0.009638988
[19] 0.008323206 0.007305972 0.006497101
範例2:
# R Program to compute
# Weibull Density

# Creating a sequence of x-values
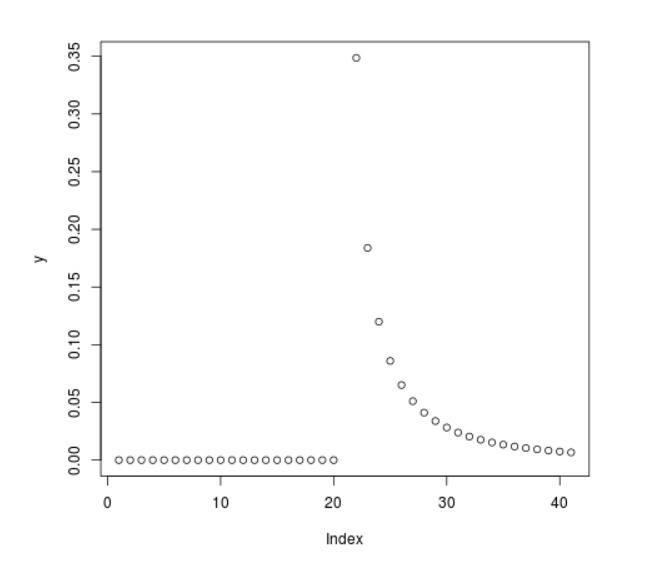
x <- seq(-10, 10, by = 0.5)

# Calling dweibull() Function
y <- dweibull(x, shape = 0.5)

# Plot a graph
plot(y)
輸出:
相關用法
- R語言 pweibull()用法及代碼示例
- R語言 rweibull()用法及代碼示例
- R語言 qweibull()用法及代碼示例
- R語言 density()用法及代碼示例
- R語言 qchisq()用法及代碼示例
- R語言 dpois()用法及代碼示例
- R語言 df()用法及代碼示例
- R語言 dunif()用法及代碼示例
- R語言 rf()用法及代碼示例
- R語言 dchisq()用法及代碼示例
- R語言 pchisq()用法及代碼示例
- R語言 dcauchy()用法及代碼示例
- R語言 pcauchy()用法及代碼示例
- R語言 rchisq()用法及代碼示例
- R語言 plogis()用法及代碼示例
- R語言 dlogis()用法及代碼示例
- R語言 rlnorm()用法及代碼示例
- R語言 plnorm()用法及代碼示例
- R語言 rcauchy()用法及代碼示例
- R語言 dlnorm()用法及代碼示例
- R語言 rlogis()用法及代碼示例
- R語言 dnbinom()用法及代碼示例
- R語言 pnbinom()用法及代碼示例
- R語言 rnbinom()用法及代碼示例
注:本文由純淨天空篩選整理自nidhi_biet大神的英文原創作品 Compute the Value of Weibull Density in R Programming – dweibull() Function。非經特殊聲明,原始代碼版權歸原作者所有,本譯文未經允許或授權,請勿轉載或複製。
