用法
step_harmonic(
  recipe,
  ...,
  role = "predictor",
  trained = FALSE,
  frequency = NA_real_,
  cycle_size = NA_real_,
  starting_val = NA_real_,
  keep_original_cols = FALSE,
  columns = NULL,
  skip = FALSE,
  id = rand_id("harmonic")
)
参数
- recipe
-
一个菜谱对象。该步骤将添加到此配方的操作序列中。
- ...
-
一个或多个选择器函数用于为此步骤选择变量。有关更多详细信息,请参阅
selections()。这通常是单个变量。 - role
-
对于此步骤创建的模型项,应为其分配什么分析角色?默认情况下,此步骤根据原始变量创建的新列将用作模型中的预测变量。
- trained
-
指示预处理数量是否已估计的逻辑。
- frequency
-
具有至少一个值的数值向量。该值必须大于零且有限。
- cycle_size
-
一种数值向量,至少有一个值指示单个周期的大小。
cycle_size应与输入变量具有相同的单位。 - starting_val
-
NA、数字、日期或 POSIXt 值,指示每个输入变量的 sin 和 cos 曲线的参考点。如果该值为Date或POISXt,则使用as.numeric将值转换为数字。可以指定该参数以增强对信号相位的控制。如果未指定starting_val,则默认值为 0。 - keep_original_cols
-
将原始变量保留在输出中的逻辑。默认为
FALSE。 - columns
-
所选变量名称的字符串。该字段是一个占位符,一旦使用
prep()就会被填充。 - skip
-
一个合乎逻辑的。当
bake()烘焙食谱时是否应该跳过此步骤?虽然所有操作都是在prep()运行时烘焙的,但某些操作可能无法对新数据进行(例如处理结果变量)。使用skip = TRUE时应小心,因为它可能会影响后续操作的计算。 - id
-
该步骤特有的字符串,用于标识它。
细节
此步骤旨在使用正弦波和余弦波的组合来说明观测数据的周期性分量。为此,使用一个 sin 和一个 cos 项对指定频率的每个波进行建模。然后可以使用每个频率的这两项来估计观测数据中周期信号的幅度和相移。将已知频率但未知相位和振幅的余弦波与正弦和余弦项之和相关联的方程如下:
求解方程产生 和 。然后可以通过以下方式获得振幅:
相位可以通过以下方式获得:
其中:
-
-
是 频率的幅度
-
是 频率的相位
-
是 频率的 cos 项系数
-
是 频率的 sin 项系数
周期分量由frequency 和cycle_size 参数指定。周期大小将指定频率与输入列单位相关。有多种方法可以指定给定频率的波,例如,POSIXct 输入列的 frequency 为 24,cycle_size 等于 86400,相当于 frequency 为 1.0,cycle_size 等于至 3600。
参考
多兰 H. E. 和奎尔基 J. J. (1972)。季节性数据的谐波分析:一些重要的属性。 《美国农业经济学杂志》,54,第 4 卷,第 1 部分,646-651。
福尔曼,M.G.G. 和亨利,R.F. (1989)。潮汐模型时间序列的调和分析。水资源进展,12(3), 109-120。
也可以看看
其他单独的转换步骤:step_BoxCox() , step_YeoJohnson() , step_bs() , step_hyperbolic() , step_inverse() , step_invlogit() , step_logit() , step_log() , step_mutate() , step_ns() , step_percentile() , step_poly() , step_relu() , step_sqrt()
例子
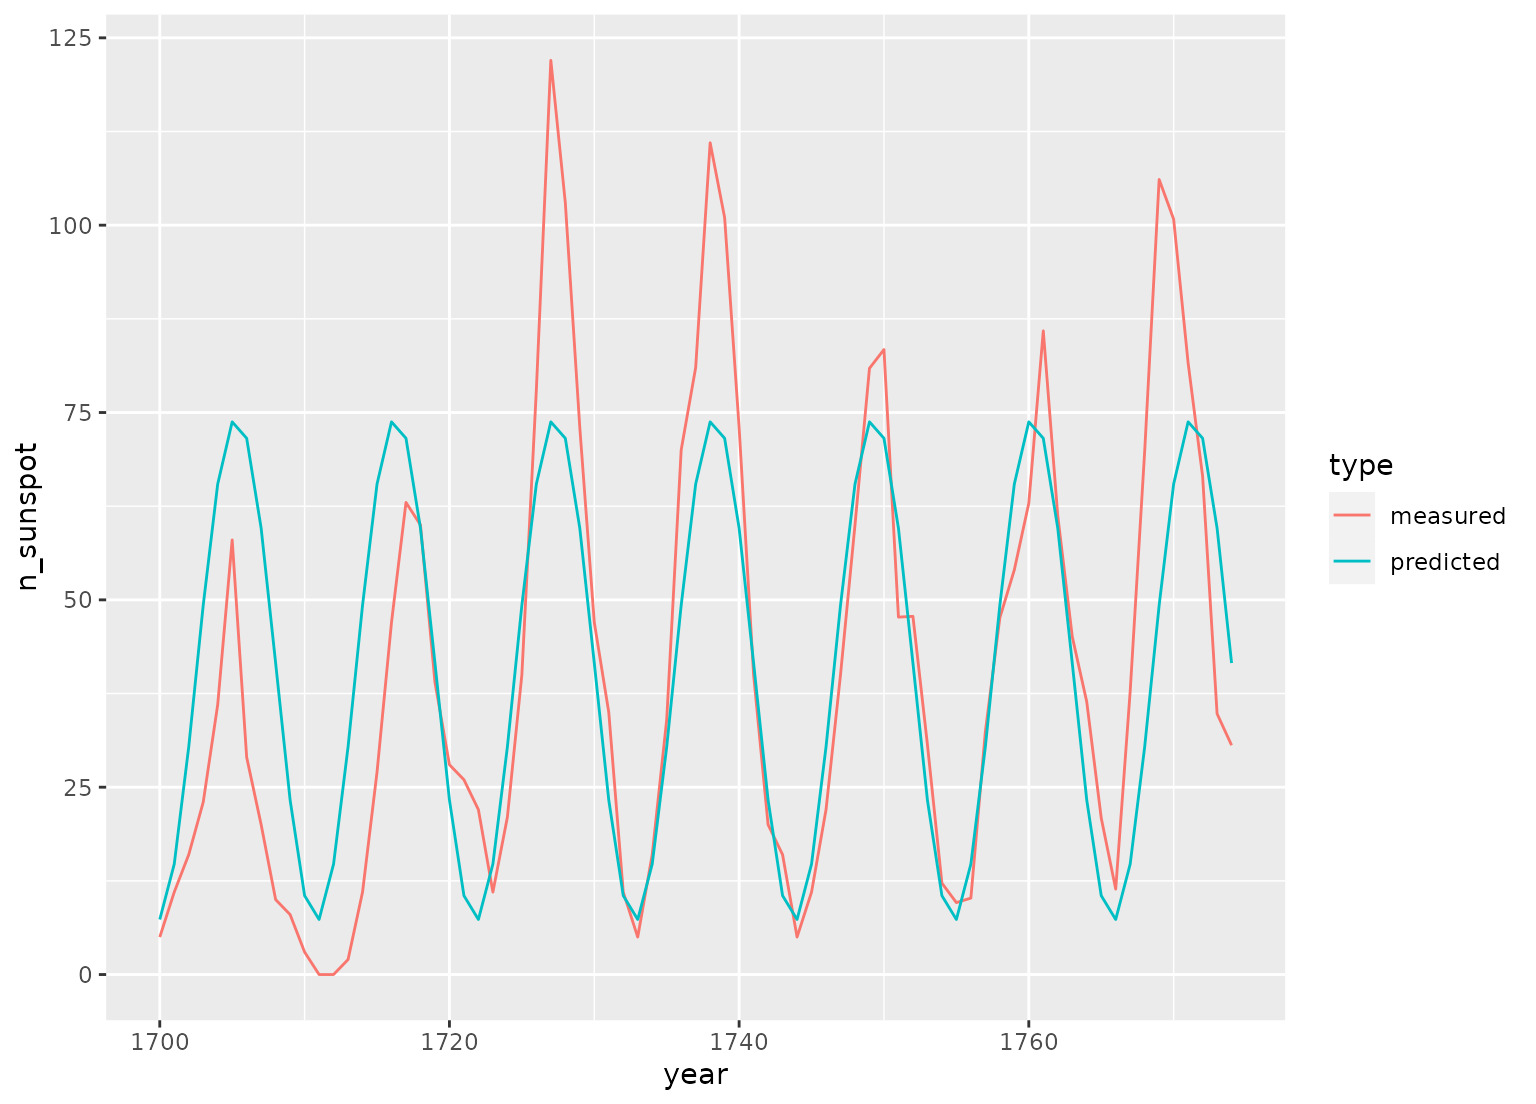
library(ggplot2, quietly = TRUE)
library(dplyr)

data(sunspot.year)
sunspots <-
  tibble(
    year = 1700:1988,
    n_sunspot = sunspot.year,
    type = "measured"
  ) %>%
  slice(1:75)

# sunspots period is around 11 years, sample spacing is one year
dat <- recipe(n_sunspot ~ year, data = sunspots) %>%
  step_harmonic(year, frequency = 1 / 11, cycle_size = 1) %>%
  prep() %>%
  bake(new_data = NULL)

fit <- lm(n_sunspot ~ year_sin_1 + year_cos_1, data = dat)

preds <- tibble(
  year = sunspots$year,
  n_sunspot = fit$fitted.values,
  type = "predicted"
)

bind_rows(sunspots, preds) %>%
  ggplot(aes(x = year, y = n_sunspot, color = type)) +
  geom_line()


# ------------------------------------------------------------------------------
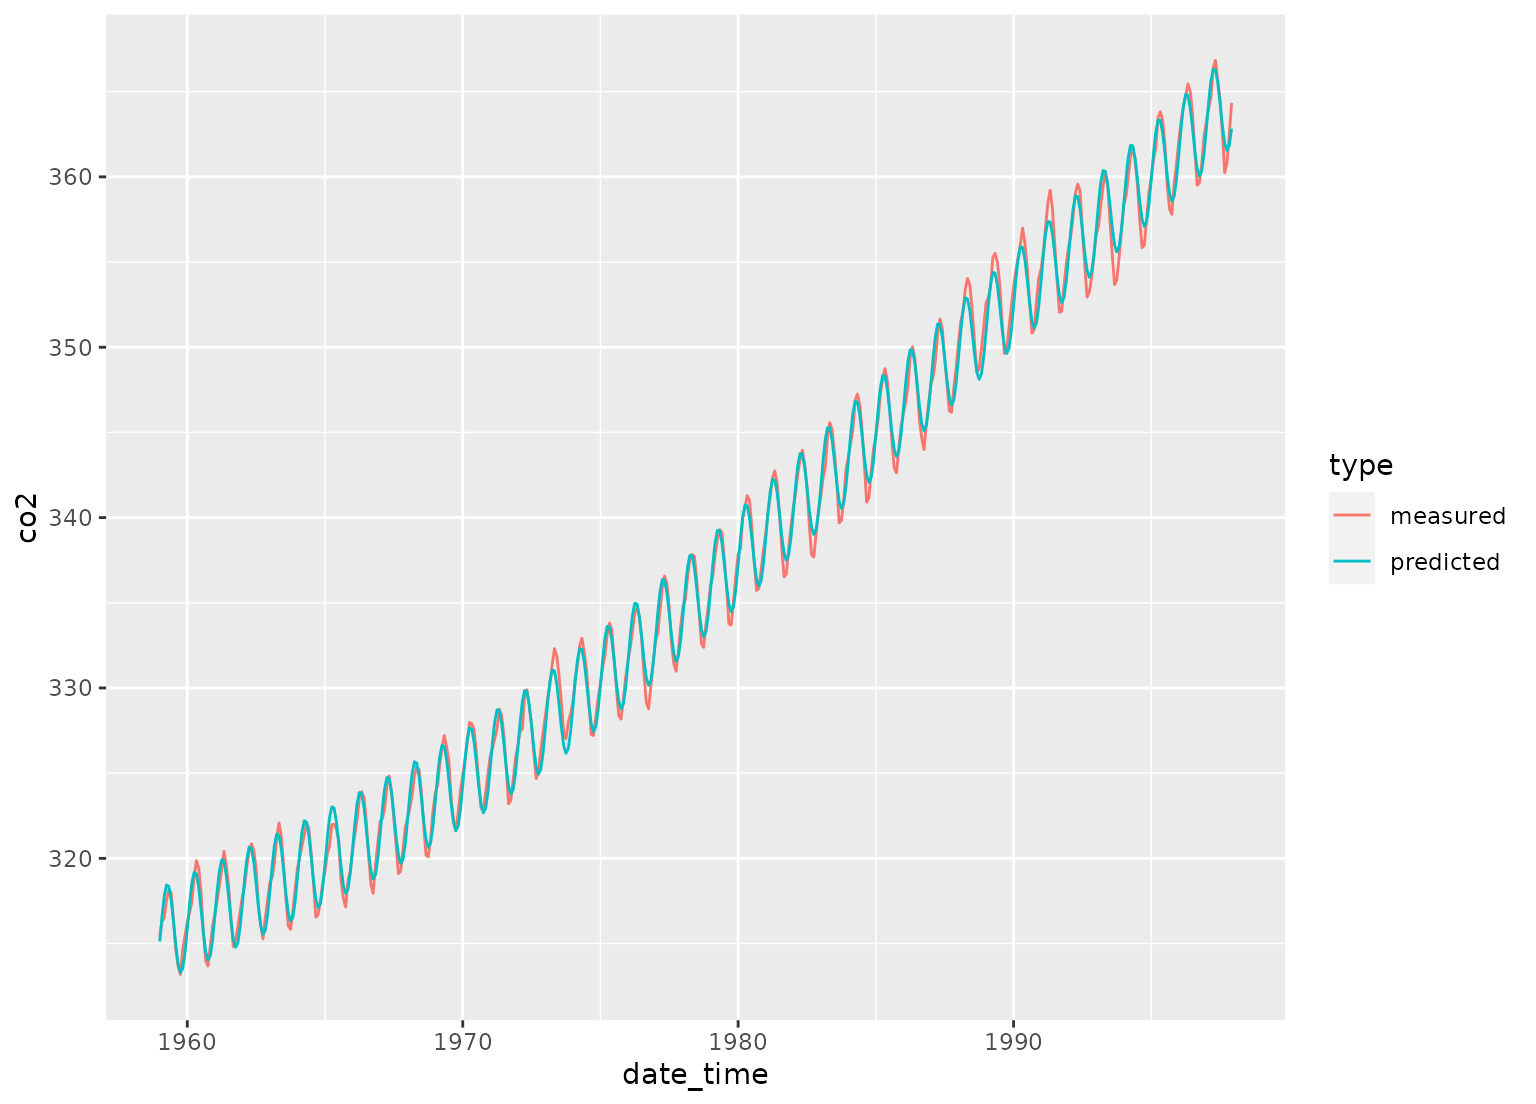
# POSIXct example

date_time <-
  as.POSIXct(
    paste0(rep(1959:1997, each = 12), "-", rep(1:12, length(1959:1997)), "-01"),
    tz = "UTC"
  )

carbon_dioxide <- tibble(
  date_time = date_time,
  co2 = as.numeric(co2),
  type = "measured"
)

# yearly co2 fluctuations
dat <-
  recipe(co2 ~ date_time,
    data = carbon_dioxide
  ) %>%
  step_mutate(date_time_num = as.numeric(date_time)) %>%
  step_ns(date_time_num, deg_free = 3) %>%
  step_harmonic(date_time, frequency = 1, cycle_size = 86400 * 365.24) %>%
  prep() %>%
  bake(new_data = NULL)

fit <- lm(co2 ~ date_time_num_ns_1 + date_time_num_ns_2 +
  date_time_num_ns_3 + date_time_sin_1 +
  date_time_cos_1, data = dat)

preds <- tibble(
  date_time = date_time,
  co2 = fit$fitted.values,
  type = "predicted"
)

bind_rows(carbon_dioxide, preds) %>%
  ggplot(aes(x = date_time, y = co2, color = type)) +
  geom_line()

相关用法
- R recipes step_holiday 假日特征生成器
- R recipes step_hyperbolic 双曲变换
- R recipes step_unknown 将缺失的类别分配给“未知”
- R recipes step_relu 应用(平滑)修正线性变换
- R recipes step_poly_bernstein 广义伯恩斯坦多项式基
- R recipes step_impute_knn 通过 k 最近邻进行插补
- R recipes step_impute_mean 使用平均值估算数值数据
- R recipes step_inverse 逆变换
- R recipes step_pls 偏最小二乘特征提取
- R recipes step_ratio 比率变量创建
- R recipes step_geodist 两个地点之间的距离
- R recipes step_nzv 近零方差滤波器
- R recipes step_nnmf 非负矩阵分解信号提取
- R recipes step_normalize 中心和比例数值数据
- R recipes step_depth 数据深度
- R recipes step_other 折叠一些分类级别
- R recipes step_corr 高相关滤波器
- R recipes step_novel 新因子水平的简单赋值
- R recipes step_select 使用 dplyr 选择变量
- R recipes step_regex 检测正则表达式
- R recipes step_spline_b 基础样条
- R recipes step_window 移动窗口函数
- R recipes step_ica ICA 信号提取
- R recipes step_discretize 离散数值变量
- R recipes step_dummy_multi_choice 一起处理多个预测变量的水平
注:本文由纯净天空筛选整理自Max Kuhn等大神的英文原创作品 Add sin and cos terms for harmonic analysis。非经特殊声明,原始代码版权归原作者所有,本译文未经允许或授权,请勿转载或复制。
